A
B
C
D

Text Solution
Verified by Experts
The correct Answer is:


Similar Questions
Explore conceptually related problems
Recommended Questions
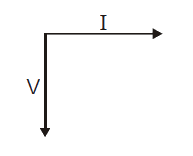
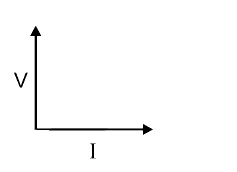
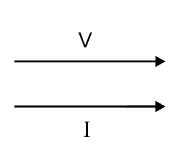
- Which of the following figure showing the phase relationship is correc...
Text Solution
|
- Which of the following phase diagram is/are not correct for water?
Text Solution
|
- The phase diagram for sulphur is shown below. Which statement about th...
Text Solution
|
- With the help of following phase diagram, select the correct statement...
Text Solution
|
- Which of the following figure showing the phase relationship is correc...
Text Solution
|
- নীচের চিত্রটিতে কোশ বিভাজনের একটি দশা দেখানো হয়েছে। নিম্নলিখিত বিকল্প...
Text Solution
|
- What is a phasor ? What is the phase difference between current and vo...
Text Solution
|
- The diagram shows the profile of a wave, which of the following pairs...
Text Solution
|
- What is a phasor? What is the phase difference between current and vol...
Text Solution
|