


Similar Questions
Explore conceptually related problems
Recommended Questions
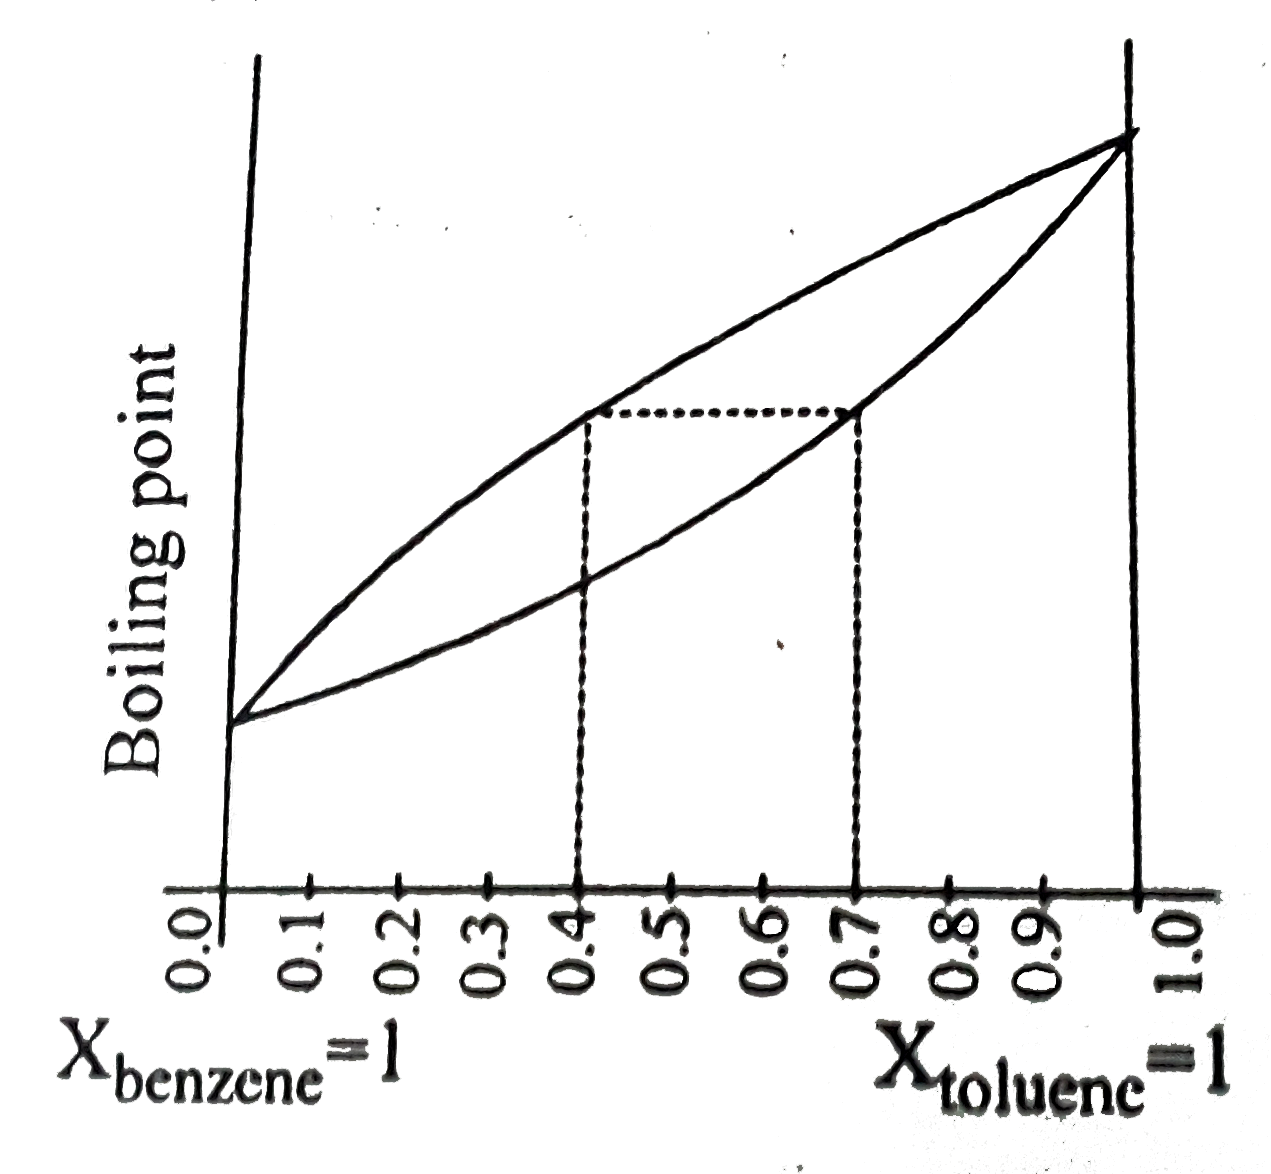
- The following graph represents variation of boiling point with composi...
Text Solution
|
- The following is a graph plotted between the vapour pressure of two vo...
Text Solution
|
- The following graph represents variation of boiling point with composi...
Text Solution
|
- The following graph represents variation of vapour pressre with compos...
Text Solution
|
- Which of the following binary mixture will have same composition in li...
Text Solution
|
- If P(A) is the vapour pressure of a pure liquid A and the mole fractio...
Text Solution
|
- Which of the following binary mixture will have same composition in li...
Text Solution
|
- If x(1) and x(2) represent the mole fraction of a component A in the v...
Text Solution
|
- The following graph represents variation of boiling point with composi...
Text Solution
|