A
B
C
D
Text Solution
Verified by Experts
The correct Answer is:


Similar Questions
Explore conceptually related problems
Recommended Questions
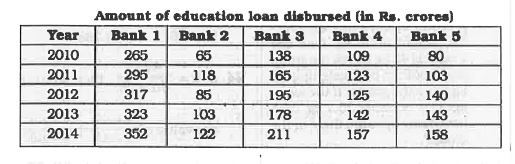
- The table given below represents the amount of education loan ( in Rs....
Text Solution
|
- The table given below represents the amount of education loan ( in Rs....
Text Solution
|
- The table given below represents the amount of education loan ( in Rs....
Text Solution
|
- The table given below represents the amount of education loan ( in Rs....
Text Solution
|
- The table given below represents the amount of education loan ( in Rs....
Text Solution
|
- Number of sick industrial units in different years (xx 1000) and outst...
Text Solution
|
- Read the following table and answer the questions below it: In wh...
Text Solution
|
- Read the following table and answer the questions below it: What ...
Text Solution
|
- Read the following table and answer the questions below it: In wh...
Text Solution
|