A
B
C
D
Text Solution
Verified by Experts
The correct Answer is:


Topper's Solved these Questions
THERMODYANMICS
KUMAR PRAKASHAN|Exercise Section-D Ncert Exemplar Solution (MCQs More than one option )|5 VideosTHERMODYANMICS
KUMAR PRAKASHAN|Exercise Section-D Ncert Exemplar Solution (Very Short Answer )|5 VideosTHERMODYANMICS
KUMAR PRAKASHAN|Exercise Section-C (Objective Questions (Assertion & Reason )|8 VideosTHERMAL PROPERTIES OF MATTER
KUMAR PRAKASHAN|Exercise Question Paper (Section - D) (Answer following in brief :) Each carry 4 marks|1 VideosUNITS AND MEASUREMENT
KUMAR PRAKASHAN|Exercise Section -F (Questions from Module )|20 Videos
Similar Questions
Explore conceptually related problems
KUMAR PRAKASHAN-THERMODYANMICS -Section-D Ncert Exemplar Solution (MCQs)
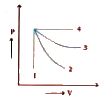
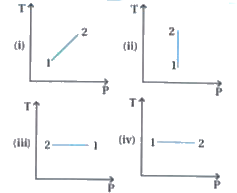
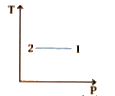
- An ideal gas undergoes four different processes from the same initial ...
Text Solution
|
- If an average person jogs he produces 14.5 xx 10^3 cal/min. This is re...
Text Solution
|
- Consider P to V diagram for an ideal gas shown in figure. Out of...
Text Solution
|
- An ideal gas undergoes cyclic process ABCDA as shown in given P - V di...
Text Solution
|
- Consider two containers A and B containing identical gases at the same...
Text Solution
|
- Three copper blocks of masses M1, M2 and M3 kg respectively are brough...
Text Solution
|