Home
Class 11
MATHS
The mean and standard deviation of marks...

The mean and standard deviation of marks obtained by. 50 students of a class in. three subjects, Mathematics, Physics and Chemistry are given below.

Which of three subjects shows the highest variability, in marks and which shows the lowest?

Promotional Banner

Topper's Solved these Questions

  • SETS

    V PUBLICATION|Exercise QUESTION BANK|116 Videos
  • STRAIGHT LINES

    V PUBLICATION|Exercise QUESTIONBANK|99 Videos

Similar Questions

Explore conceptually related problems

The mean and standard deviation of marks obtained by 50 students of a class in three subjects , mathematics ,Physics and Chemistry are given below : Which of the three subject shows the highest variability in marks and which shows the lowest?

The mean and S.D. of marks obtained by 50 students of a class in three subjects mathematics , physics and chemistry are given below? which of the three subjects the highest variability in marks and which shows the lowest?

The mean and standard deviation of marks obtained by 50 students in a class in two subjects , mathematics and accountancy are given below : Which of the subject shows the highest variability in marks? and why?

The figure of an incomplete periodic table is given below. Which of these elements show variable oxidation state?

Marks obtained in mathematics examination are given below:(i)Mean of the marks……..

Consider the following data in respect of marks of 50 students in mathematics and physics. Which subject shows more variability?

Consider the following data in respect of marks of 50 students in mathematics and physics. Which subject shows more consistent?

Young's moduli of three materials are given in the above table. Select the material from the table, which shows more elasticity.

Marks obtained in mathematics examination are given below:(iii)Find standard deviation of marks

V PUBLICATION-STATISTICS-QUESTION BANK
  1. Find the mean and variance of the first 10 multiples of 3.

    Text Solution

    |

  2. Find the mean and standard deviation using short-cut method

    Text Solution

    |

  3. Find the mean and variance for the following frequency distribution.

    Text Solution

    |

  4. Find the mean, variance and standard deviation using short cut method.

    Text Solution

    |

  5. Two plants A and B of a factory show following results about the numbe...

    Text Solution

    |

  6. Coefficient of variation of two distributions are 60 and 70 and their ...

    Text Solution

    |

  7. The following values are calculated in respect of heights and weights ...

    Text Solution

    |

  8. The following is the rècord of goals scored by team '(A)' in a footbal...

    Text Solution

    |

  9. The sum and squares corresponding to length x(in cm) and y(in gm) of 5...

    Text Solution

    |

  10. The variance of 20 observations is '5 .' If each observation is multip...

    Text Solution

    |

  11. The mean of 5 observations is 4.4 and their variance is 8.24.If three ...

    Text Solution

    |

  12. If each of the observation x1,x2,………..xn is increased by 'a',where a...

    Text Solution

    |

  13. The mean and standard deviation of 100 observations were calculated as...

    Text Solution

    |

  14. The mean and variance of 7 observations are 8 and 16 respectively. If ...

    Text Solution

    |

  15. The mean and standard deviation of six observations are 8 and 4, respe...

    Text Solution

    |

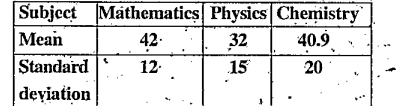
  16. The mean and standard deviation of marks obtained by. 50 students of a...

    Text Solution

    |

  17. Calculate the mean deviation about median from the following data 340...

    Text Solution

    |

  18. Find the mean deviation about the mean for the following data: 6,7,10,...

    Text Solution

    |

  19. Find the variance and standard deviation for the following data 65,68...

    Text Solution

    |

  20. If each of the observation x1,x2,………..xn is increased by 'a',where a...

    Text Solution

    |