A
B
C
D
Text Solution
Verified by Experts
The correct Answer is:


Similar Questions
Explore conceptually related problems
Recommended Questions
- Study the graph and answer the question given below. The given graph...
Text Solution
|
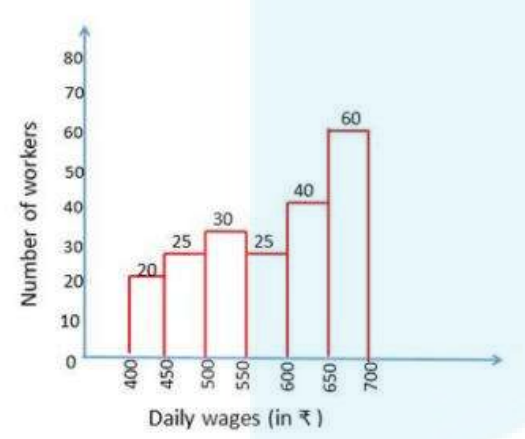
- Below is given the frequency distribution of Daily wages (in rs ) of 1...
Text Solution
|
- Given below is the frequency distribution of daily wages (in Rs) of 13...
Text Solution
|
- Given below is the frequency distribution of daily wages (in Rs) of 1...
Text Solution
|
- Total daily wages of the workers in a factory is 3150 rupees. If the n...
Text Solution
|
- The table representing the daily wages of workers ina factory is given...
Text Solution
|
- The table representing the daily wages of workers ina factory is given...
Text Solution
|
- In factory, the daily wages (in Rs.) of 12 works are 75, 90 100, 120, ...
Text Solution
|
- Study the graph and answer the question that follows. What is the ra...
Text Solution
|