
A
B
C
D
Text Solution
Verified by Experts
The correct Answer is:


Topper's Solved these Questions
ELECTRON, PHOTON, PHOTOELECTRIC EFFECT & X -RAY
ERRORLESS|Exercise NCERT BASED QUESTIONS (X-Rays)|34 VideosELECTRON, PHOTON, PHOTOELECTRIC EFFECT & X -RAY
ERRORLESS|Exercise PAST YEARS QUESTIONS|71 VideosELECTRON, PHOTON, PHOTOELECTRIC EFFECT & X -RAY
ERRORLESS|Exercise NCERT BASED QUESTIONS (Matter Waves)|24 VideosELECTROMAGNETIC INDUCTION
ERRORLESS|Exercise ASSERTION & REASON|20 VideosELECTRONICS
ERRORLESS|Exercise Assertion & Reason|26 Videos
Similar Questions
Explore conceptually related problems
ERRORLESS-ELECTRON, PHOTON, PHOTOELECTRIC EFFECT & X -RAY-NCERT BASED QUESTIONS (Photon and Photoelectric Effect)
- The maximum velocity of an electron emitted by light of wavelength lam...
Text Solution
|
- Light from a hydrogen discharge tube is incidenton the cathode of a ph...
Text Solution
|
- According to Einstein's photoelectric equation, the graph between the ...
Text Solution
|
- The stopping potential V for photo-electric emission from a metal surf...
Text Solution
|
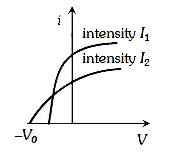
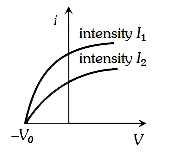
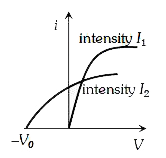
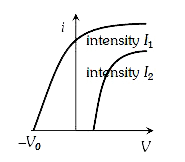
- The curve between current (i) and potential difference (V) for a phot...
Text Solution
|
- The correct curve between the stopping potential (V) and intensity of ...
Text Solution
|
- In the following diagram if V2 gt V1 then
Text Solution
|
- The stopping potential (V(0)) versus frequency (v) plot of a substance...
Text Solution
|
- Figure represents a graph of kinetic energy (K) of photoelectrons (in ...
Text Solution
|
- Figure represents the graph of photo current I versus applied ...
Text Solution
|
- From the figure describing photoelectric effect we may infer correctly...
Text Solution
|
- Which of the following facts about the photoelectric effect can be und...
Text Solution
|
- A photo cell is receiving light from a source placed at a distance of ...
Text Solution
|
- A caesium photocell, with a steady potential difference of 60 V across...
Text Solution
|
- A photocell is illuminated by a small bright source placed 1m away. Wh...
Text Solution
|
- In a photoelectric experiment, if both the intensity and frequency of ...
Text Solution
|
- When a monochromatic point source of light is at a distance 0.2 m from...
Text Solution
|
- When a monochromatic point source of light is at a distance of 0.2 m f...
Text Solution
|
- A stream of photons having energy 3 eV each impinges on a potassium su...
Text Solution
|
- The curve (a),(b) (c) and (d) show the variation between the applied p...
Text Solution
|