Home
Class 11
PHYSICS
The acceleration - velocity graph of a p...

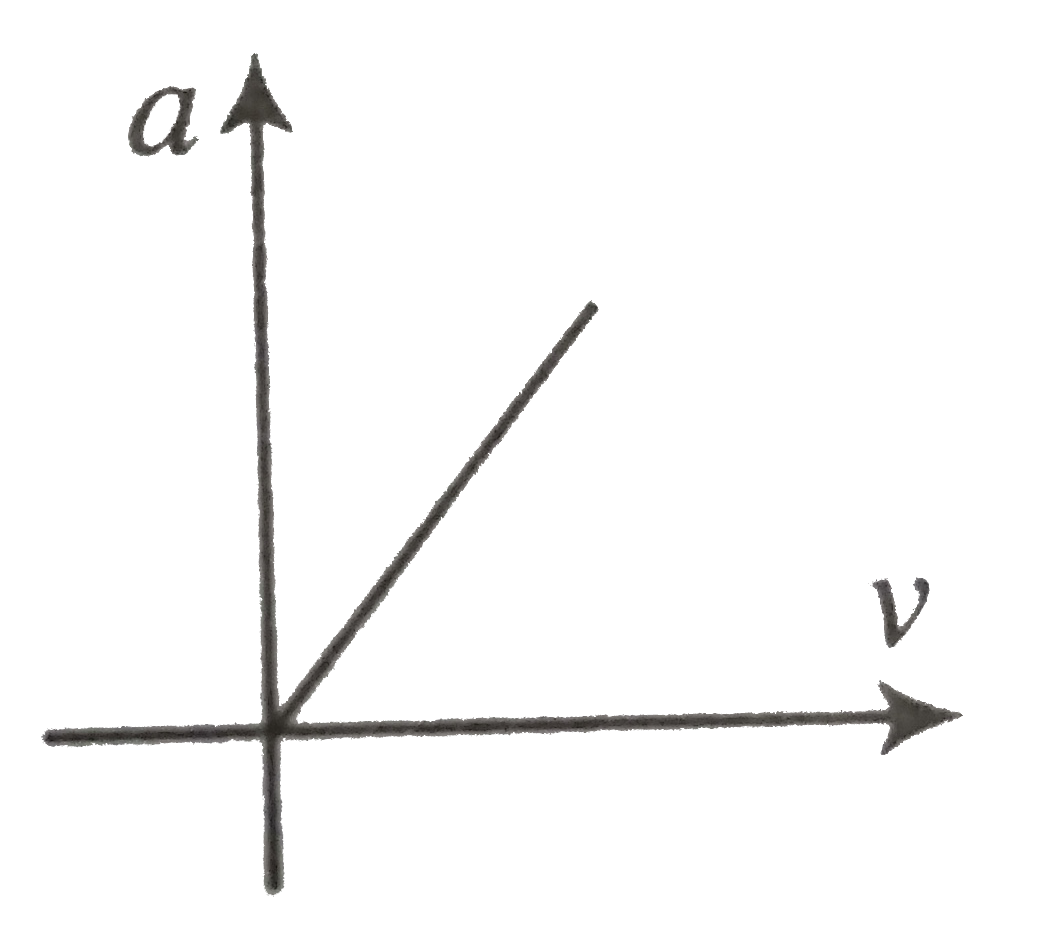
The acceleration - velocity graph of a particle moving in a straight line is shown in figure. Then the slope of the velocity- displacement graph

A

increases linearly

B

decreases linearly

C

is constant

D

increases parabolically

Text Solution

Verified by Experts

The correct Answer is:
C

c. Acceleration- velocity equation from the graph is
a = kv, where k is the slope of given line.
This can also be written as
`v(dv)/(ds) = kv rArr (dv)/(ds) = k`
i.e. slope of velocity - displacement graph is same as slope of
acceleration- velocity graph which is constant.
Doubtnut Promotions Banner Mobile Dark
|

Topper's Solved these Questions

  • MISCELLANEOUS KINEMATICS

    CENGAGE PHYSICS|Exercise Multiple Correct Answer Type|26 Videos
  • MISCELLANEOUS KINEMATICS

    CENGAGE PHYSICS|Exercise Linked Comprehension Type|35 Videos
  • LINEAR AND ANGULAR SIMPLE HARMONIC MOTION

    CENGAGE PHYSICS|Exercise Multiple Correct Answer Type|9 Videos
  • MISCELLANEOUS VOLUME 2

    CENGAGE PHYSICS|Exercise INTEGER_TYPE|10 Videos

Similar Questions

Explore conceptually related problems

The acceleration versus time graph of a particle moving along a straight line is shown in the figure. Draw the respective velocity-time graph Given v=0 at t=0.

Acceleration versus velocity graph of a particle moving in a straight line starting form rest is as shown in figure. The corresponding velocity-time graph would be :

Knowledge Check

  • Acceleration-velocity graph of a particle moving in a straight line is as shown in the figure. Then slope of velocity-displacement graph

    A
    increases linearly
    B
    decrease linearly
    C
    is constant
    D
    increases parabolically
  • Displacement time graph of a particle moving in a straight line is a shown in figure.

    A
    in region `A` acceleration is positive
    B
    in region `B` acceleration is negative
    C
    in region `C` acceleration is positive
    D
    in region `D` acceleration is negative
  • Velocity displacement graph of a particle moving in a straight line is as shown in figure.

    A
    magnitude of acceleration of particle is decreasing
    B
    magnitude of acceleration of particlre is increasing
    C
    acceleration versus displacement graph straight line
    D
    acceleration versus displacement graph is parabola
  • Similar Questions

    Explore conceptually related problems

    The acceleration-displacement graph of a particle moving in a straight line is as shown in figure, initial velocity of particle is zero. Find the velocity of the particle when displacement of the particle is s=12 m .

    The velocity-time graph of a particle moving along a straight line is shown in Figure 2.W7.Is the motion uniform?

    The velocity-time graph of a body moving in a straight line is shown in the figure.

    The velocity displacement graph of a particle moving along a straight line is shown in figure. Then the acceleration displacement graph is.

    The acceleration-time graph of a particle moving in a straight line is as shown in figure. The velocity of the particle at time t = 0 is 2 m//s . The velocity after 2 seconds will be