A
B
C
D
Text Solution
AI Generated Solution
The correct Answer is:


Topper's Solved these Questions
Similar Questions
Explore conceptually related problems
A2Z-THERMAL PROPERTIES OF MATTER-AIIMS Questions
- The density of a substance at 0^(@)C is 10 g//c c and at 100^(@)C, its...
Text Solution
|
- A black body at a temperature of 227^(@)C radiates heat at a rate of 2...
Text Solution
|
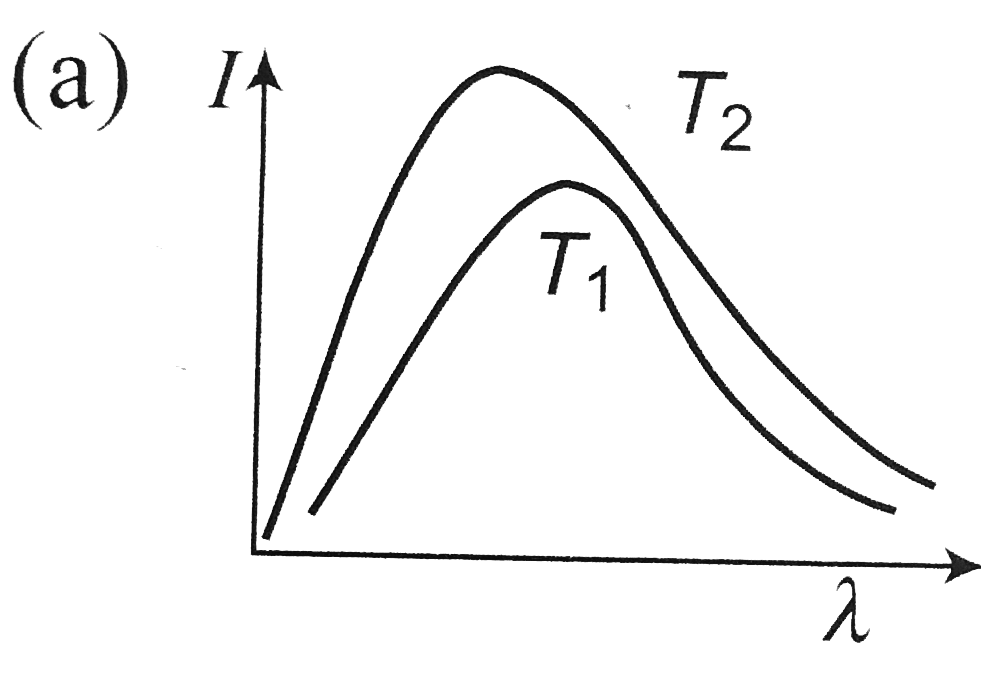
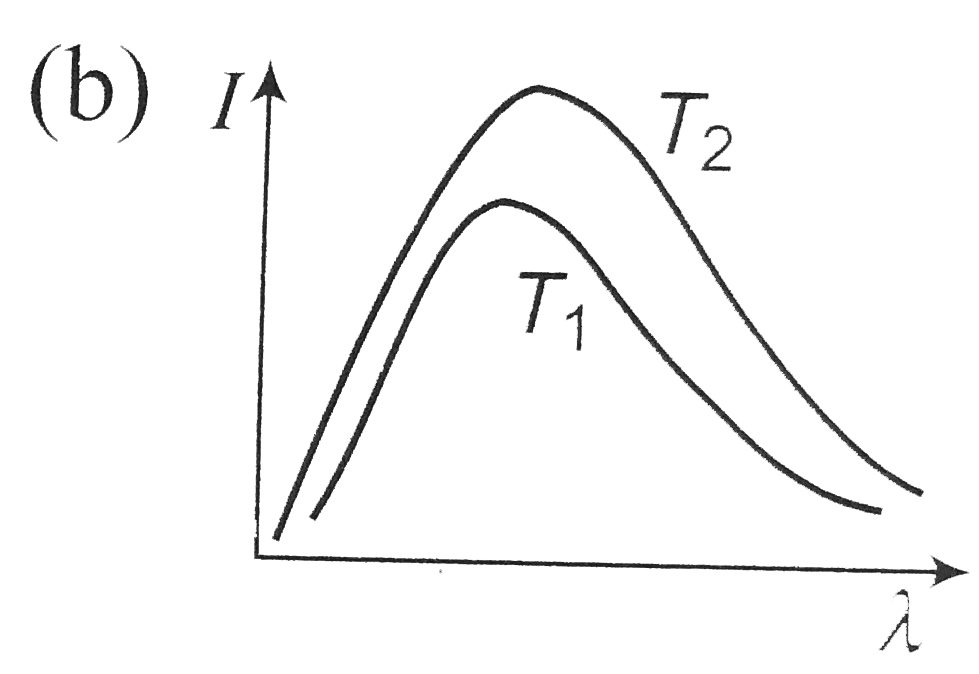
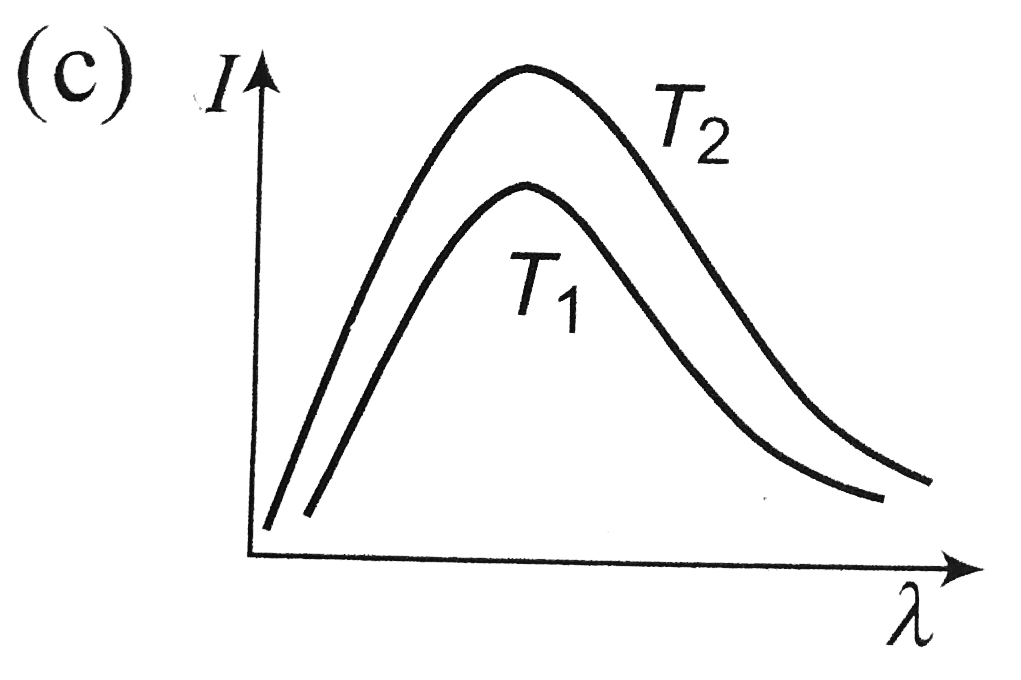
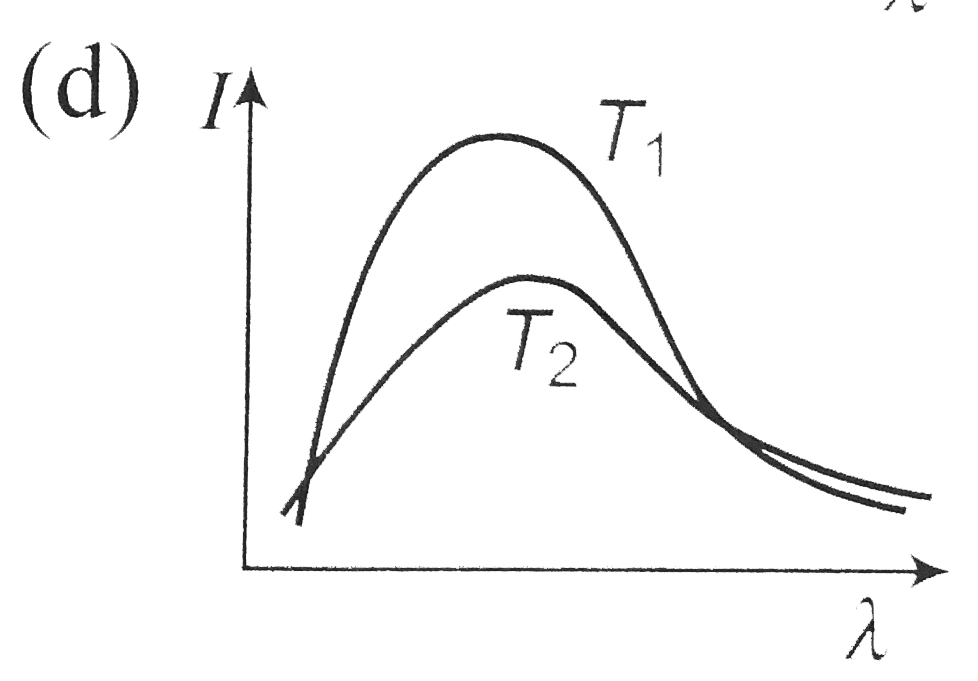
- Shown below are the black body radiation curves at temperature T(1) an...
Text Solution
|
- Suppose the sun expands so that its radius becomes 100 times its prese...
Text Solution
|
- Three objects coloured black, gray and white can withstand hostile con...
Text Solution
|
- A bimetallic strip consists of metals X and Y, it is mounted rigidly a...
Text Solution
|
- A brass disc fits snugly in a hole in a steel plate. Should you heat o...
Text Solution
|
- On heating a liquid of coefficient of cubical expansion gamma in a con...
Text Solution
|
- The coefficient of thermal conductivity of copper, mercury and glass a...
Text Solution
|
- The initial temperature of a body is 80^(@)C. If its temperature falls...
Text Solution
|
- At 1 atmospheric pressure, 1.000 g of water having a volume of 1.000 ...
Text Solution
|
- Assertion : Woolen clothes keep the body warm in winter Reason : Air...
Text Solution
|
- Assertion : Blue star is at high temperature than red star. Reason :...
Text Solution
|
- Assertion : Temperature near the sea-coast are moderate. Reason : Wa...
Text Solution
|
- Assertion : It is hotter over the top of a fire than at the same dista...
Text Solution
|
- Assertion : The melting point of ice decreases with increase of pressu...
Text Solution
|
- Assertion : A body that is a good radiator is also a good absorber of ...
Text Solution
|
- Assertion : For higher temperature, the peak emission wavelength of a ...
Text Solution
|
- Assertion : Perspiration from human body helps in cooling the body. ...
Text Solution
|
- Assertion : The equivalent thermal conductivity of two plates of same ...
Text Solution
|