Text Solution
Verified by Experts


Topper's Solved these Questions
Similar Questions
Explore conceptually related problems
PRADEEP-MOTION-Mock test
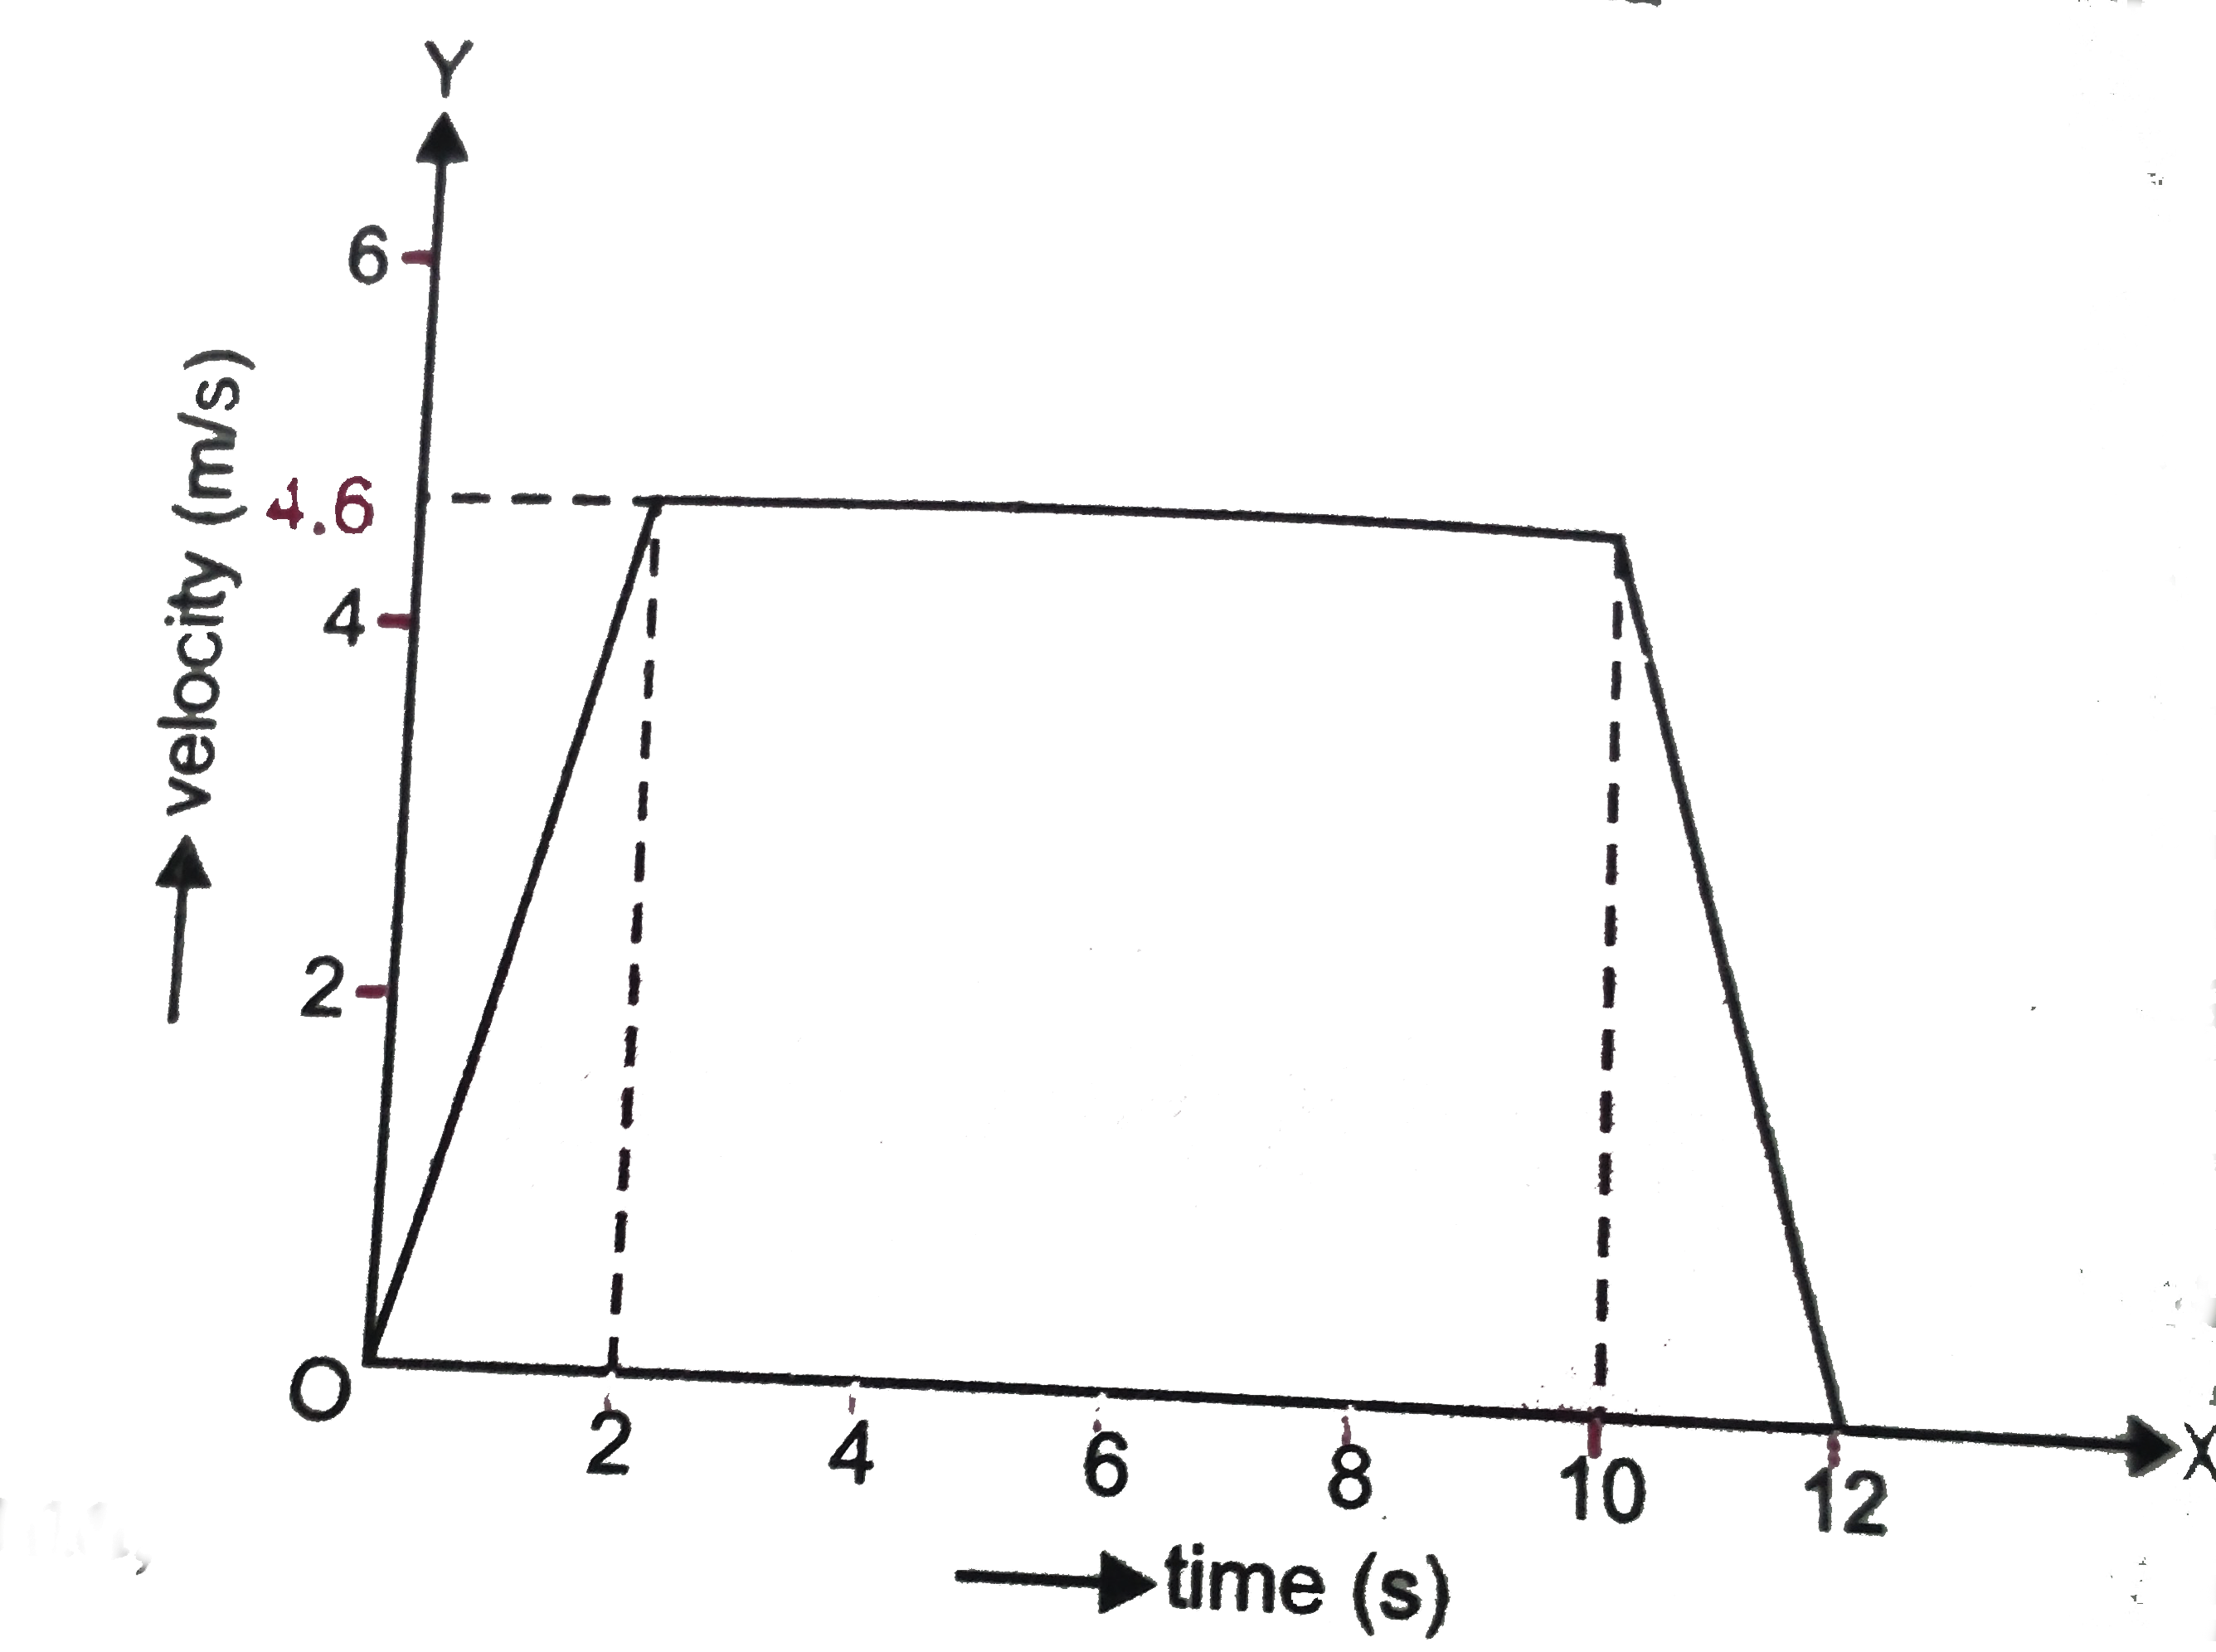
- The velocity - time graph of an ascending passenger order lift is give...
Text Solution
|
- Statement I: A body can have acceleration even if its velocity is zero...
Text Solution
|
- Can the motion of a body be accelerated even when it is moving unifrom...
Text Solution
|
- An object has moved through a distance. Can it have zero displacement ...
Text Solution
|
- Draw distance time graph of a body moving with : (i) positive accele...
Text Solution
|
- A train starting from one station accelerates uniformly over a distanc...
Text Solution
|
- (a) The velocity time graph of two bodies are shown in Figure. Slope o...
Text Solution
|
- Explain briefly the concepts of velocity and acceleration.
Text Solution
|
- How do you interpret the two graphs shwon in Figure ?
Text Solution
|
- A body is decelerating uniformly for 5 second to a constant speed and ...
Text Solution
|
- Have you ever experienced that the train in which you are sitting appe...
Text Solution
|
- A ball thrown vertically upwards with a speed of 19.6 ms^(-1) from the...
Text Solution
|
- On turning a corner, a motorist rushing at 44ms^(-1) finds a child on ...
Text Solution
|
- Brakes are applied to a train travelling at 72 km//h. After passing ov...
Text Solution
|
- A girl moves along the boundary of a square field of side 20 m in 80 s...
Text Solution
|
- Draw velocity time graph of a body (i) moving with a uniform retarda...
Text Solution
|
- Figure is the distance - time graph of an object . Do you think it rep...
Text Solution
|
- What is uniform circular motion ? Show that it is an accelerated motio...
Text Solution
|
- Automobiles are fitted with a device that shows the distance travelled...
Text Solution
|
- The speed time graph of a body is shown in Figure. Observer the graph ...
Text Solution
|
- Establish the eqaution for position time relation (i.e., s = ut + (1)...
Text Solution
|