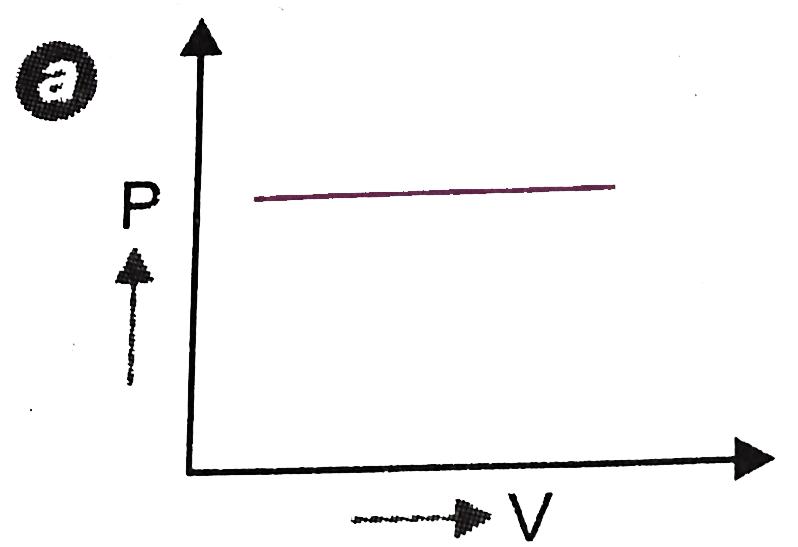
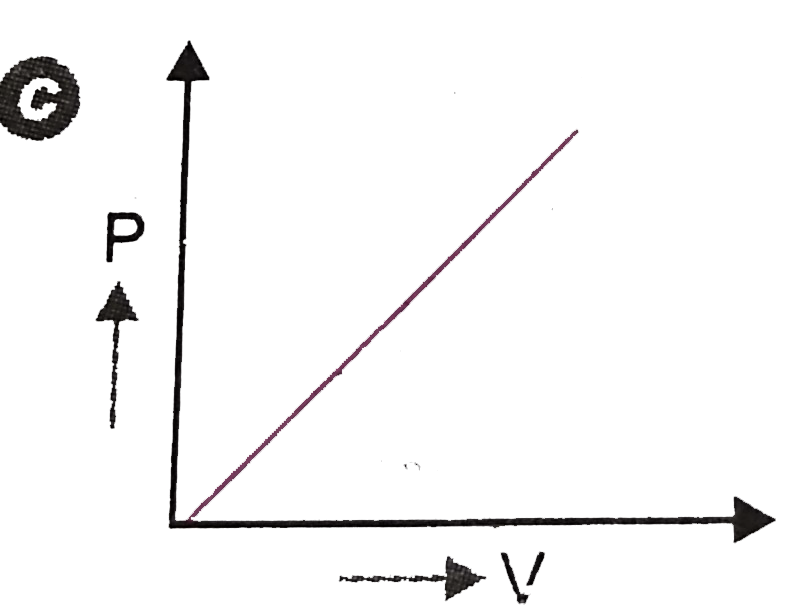
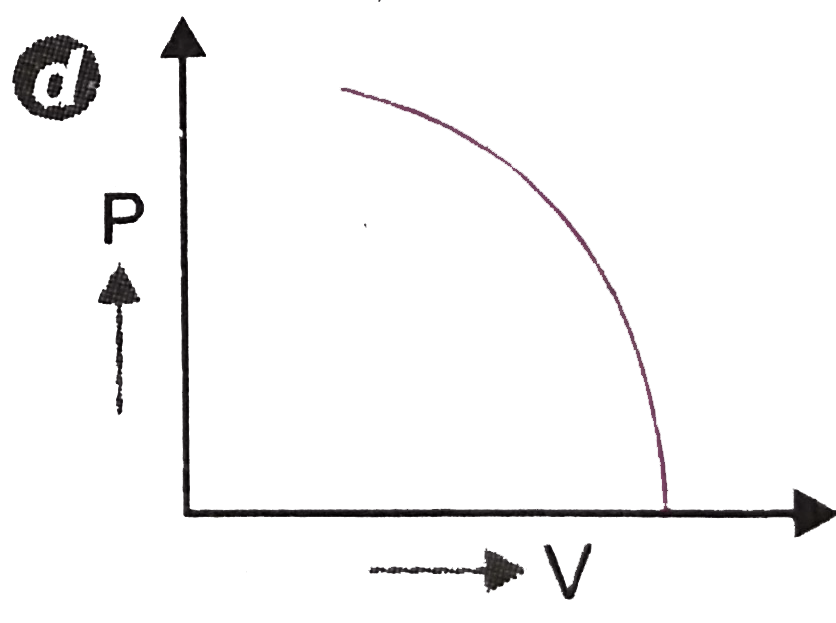
Home
Class 11
PHYSICS
Which of the following P-V diagrams best...

Which of the following `P-V` diagrams best represents an isothermal process?

A

B

C

D

Text Solution

AI Generated Solution

The correct Answer is:
To determine which `P-V` diagram best represents an isothermal process, we need to understand the characteristics of such a process. ### Step-by-Step Solution: 1. **Understanding Isothermal Process**: - An isothermal process is defined as a thermodynamic process in which the temperature remains constant. For an ideal gas, this means that the product of pressure (P) and volume (V) is constant as well, according to the equation \(PV = nRT\), where \(n\) is the number of moles and \(R\) is the ideal gas constant. 2. **Relationship Between Pressure and Volume**: - Since temperature (T) is constant, we can express the relationship between pressure and volume as: \[ PV = \text{constant} \] - Rearranging this gives: \[ P = \frac{C}{V} \] - This indicates that pressure is inversely proportional to volume. As volume increases, pressure decreases, and vice versa. 3. **Analyzing the Options**: - **Option A**: If the diagram shows pressure constant while volume changes, this does not represent an isothermal process. - **Option B**: If the diagram shows a curve where pressure decreases as volume increases, this indicates an inverse relationship, which is characteristic of an isothermal process. - **Option C**: If the diagram shows pressure and volume both increasing together, this does not represent an isothermal process. - **Option D**: If the diagram indicates that when pressure is zero, volume is also zero, this is incorrect as it contradicts the inverse relationship; when pressure is zero, volume should be infinite. 4. **Conclusion**: - The only option that accurately represents the relationship \(P \propto \frac{1}{V}\) is Option B, where pressure decreases as volume increases, indicating an isothermal process. ### Final Answer: **Option B** represents the isothermal process in the `P-V` diagram.

To determine which `P-V` diagram best represents an isothermal process, we need to understand the characteristics of such a process. ### Step-by-Step Solution: 1. **Understanding Isothermal Process**: - An isothermal process is defined as a thermodynamic process in which the temperature remains constant. For an ideal gas, this means that the product of pressure (P) and volume (V) is constant as well, according to the equation \(PV = nRT\), where \(n\) is the number of moles and \(R\) is the ideal gas constant. 2. **Relationship Between Pressure and Volume**: ...
Promotional Banner

Topper's Solved these Questions

  • THERMODYNAMICS

    PRADEEP|Exercise Interger Type questions|11 Videos
  • THERMODYNAMICS

    PRADEEP|Exercise Assertion- Reason Type Questions|19 Videos
  • THERMODYNAMICS

    PRADEEP|Exercise Multiple choice questions (NCERT)|10 Videos
  • SYSTEMS OF PARTICLES AND ROTATIONAL MOTION

    PRADEEP|Exercise Assertion- Reason Type questions|20 Videos
  • WORK, ENERGY AND POWER

    PRADEEP|Exercise Assertion-Reason Type Questions|24 Videos

Similar Questions

Explore conceptually related problems

Which of the following P-V curve best represents. As isothermal process?

Which of the following P-V diagram represent the graph of isometric process?

Which of the following venn-diagrams best represents the sets of females, mothers and doctors ?

Which of the following diagrams best represents cousins, nieces and females ?

Which of the following Venn diagrams best represents the relationship between the following classes? Accountants, Girls, Internet users

Which of the following Venn diagrams best represents the relationship between the following classes ? Lady Constables, Uncles, Mothers

PRADEEP-THERMODYNAMICS-Multiple choice questions.
  1. Consider two containers A and B containing identical gases at the same...

    Text Solution

    |

  2. Consider a spherical shell of radius R at temperature T. The black bod...

    Text Solution

    |

  3. Which of the following P-V diagrams best represents an isothermal proc...

    Text Solution

    |

  4. The pressure of a gas is increased by 50% at constant temperature. The...

    Text Solution

    |

  5. A thermodynamic system undergoes cyclic process ABCDA as shown in figu...

    Text Solution

    |

  6. One mole of an ideal diatomic gas undergoes a transition from A to B a...

    Text Solution

    |

  7. At 27^@C two moles of an ideal monoatomic gas occupy a volume V. The g...

    Text Solution

    |

  8. In the above question, change in internal energy of gas is

    Text Solution

    |

  9. 400 c c volume of gas having gamma=5/2 is suddenly compressed to 100 c...

    Text Solution

    |

  10. One mole of a diatomic ideal gas undergoes a cyclic process ABC as sho...

    Text Solution

    |

  11. A thermodynamic system is taken from an initial state I with internal ...

    Text Solution

    |

  12. During an adiabatic process, the pressure of a gas is found to be prop...

    Text Solution

    |

  13. Starting with the same initial conditions, an ideal gas expands from v...

    Text Solution

    |

  14. P-V plots for two gases during adiabatic processes are shown in the fi...

    Text Solution

    |

  15. The work of 142kJ is performed in order to compress one kilo mole of g...

    Text Solution

    |

  16. One mole of an ideal gas at an initial temperature true of TK does 6R ...

    Text Solution

    |

  17. In the given (V-T) diagram, what is the relation between pressure P(1)...

    Text Solution

    |

  18. The P-V diagram of a gas undergoing a cyclic process ABCDA is shown in...

    Text Solution

    |

  19. Two moles of helium gas are taken over the cycle ABCDA, as shown in th...

    Text Solution

    |

  20. Two moles of helium gas are taken over the cycle ABCDA, as shown in th...

    Text Solution

    |