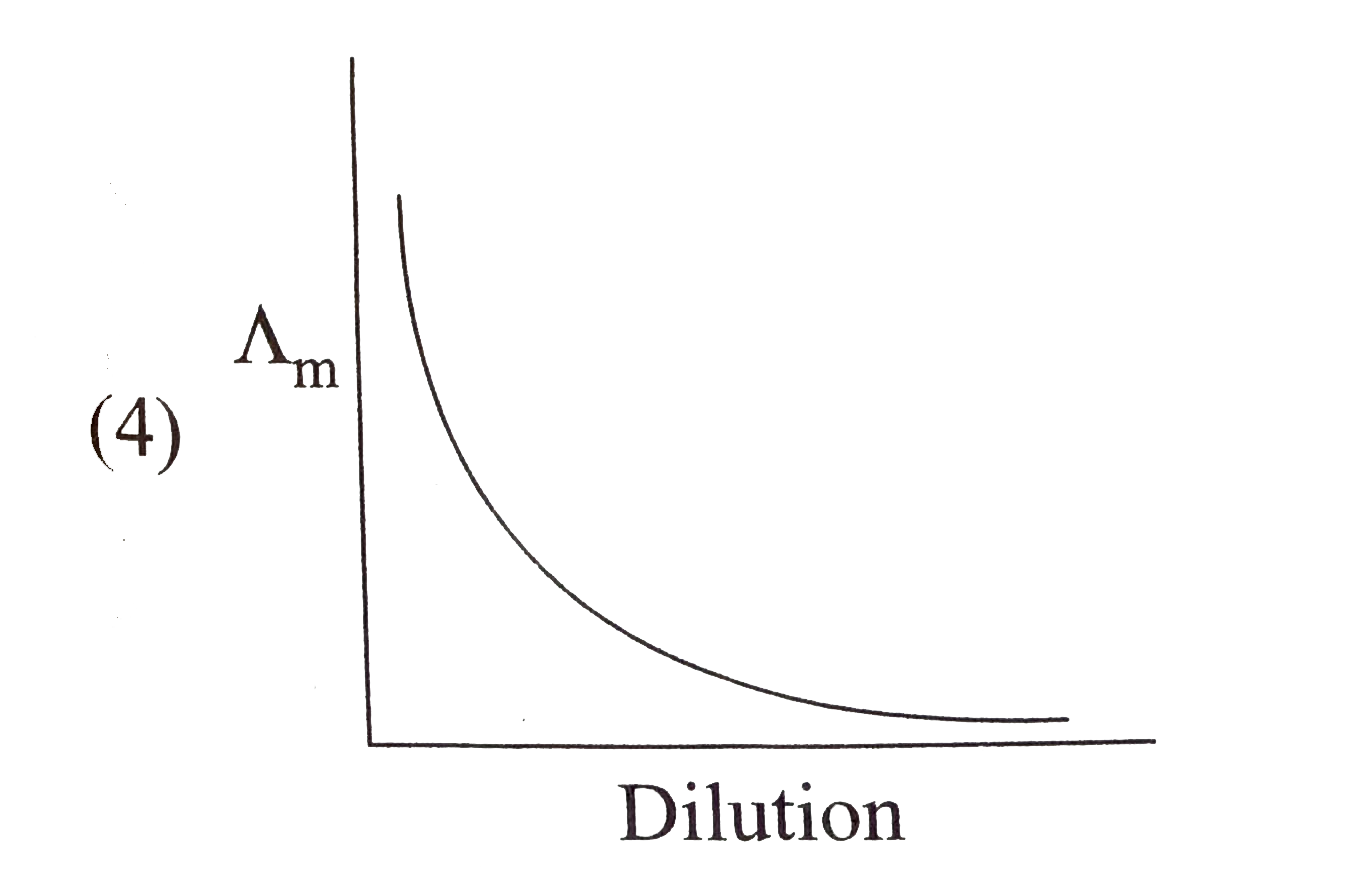
A
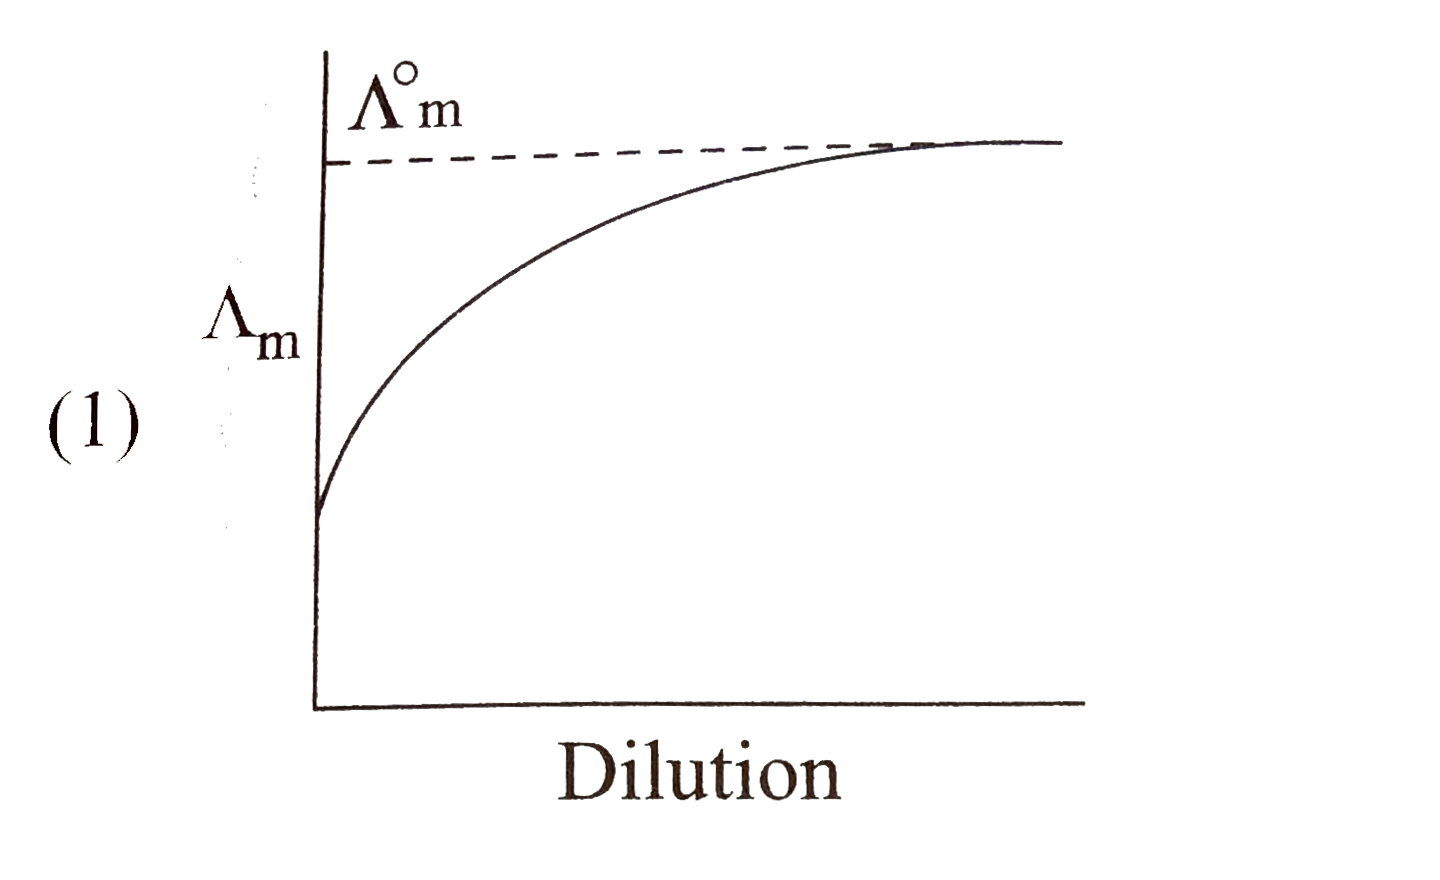
B
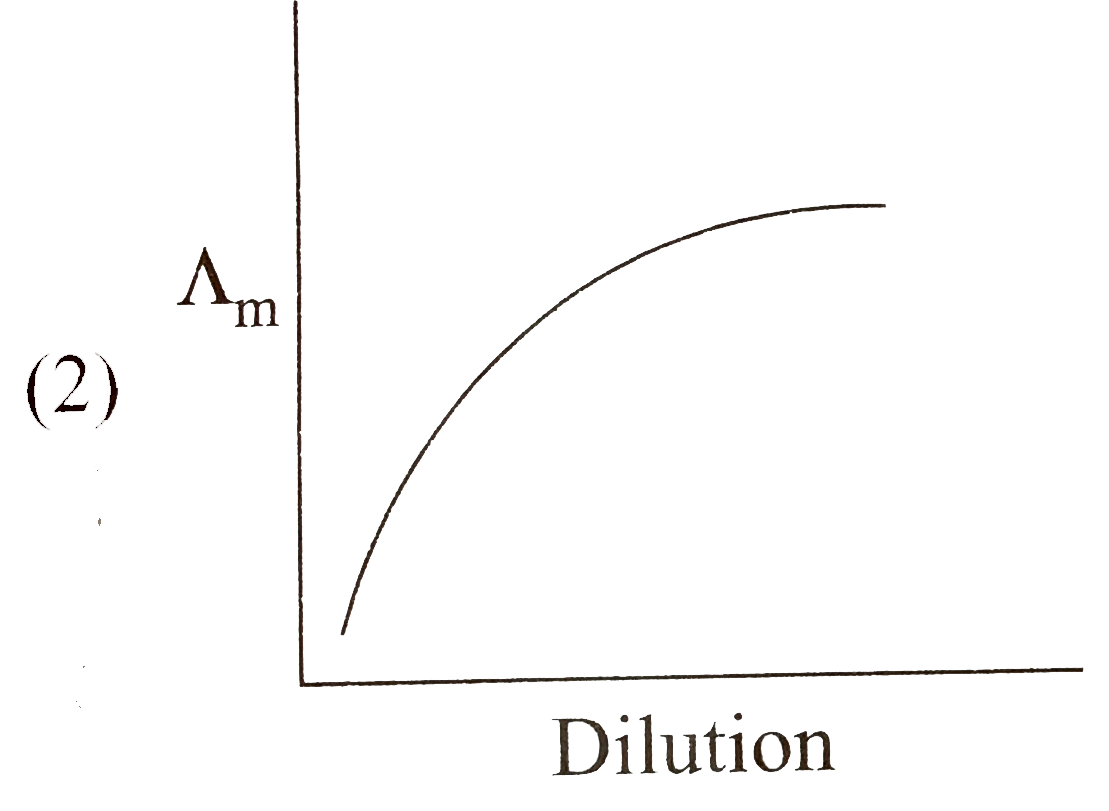
C
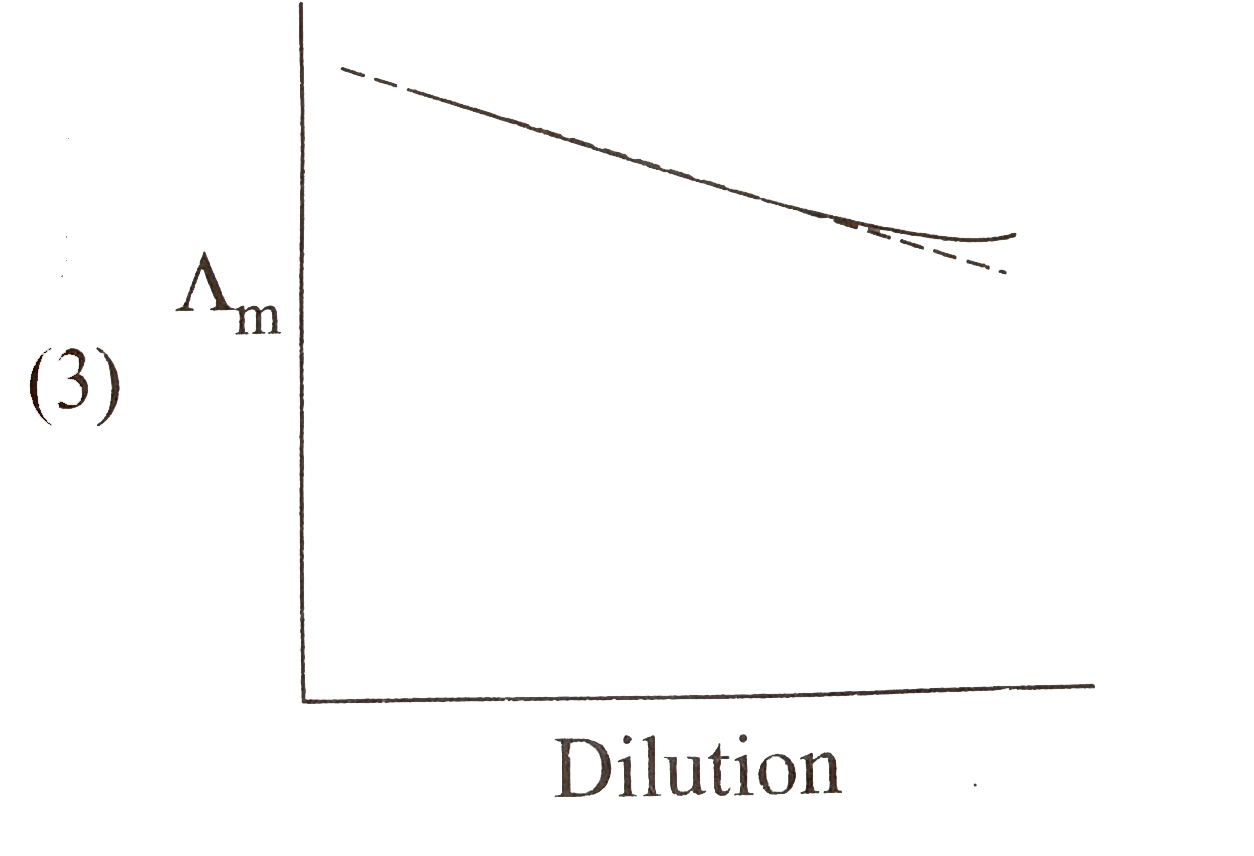
D
Text Solution
Verified by Experts
The correct Answer is:


Topper's Solved these Questions
ELECTROCHEMISTRY
R SHARMA|Exercise Follow-up Test 8|20 VideosELECTROCHEMISTRY
R SHARMA|Exercise Follow-up Test 9|11 VideosELECTROCHEMISTRY
R SHARMA|Exercise Follow-up Test 6|12 VideosCOORDINATION COMPOUNDS
R SHARMA|Exercise Archives|56 VideosGENERAL PRINCIPALS AND ISOLATION OF ELEMENTS
R SHARMA|Exercise Arechives|16 Videos
Similar Questions
Explore conceptually related problems
R SHARMA-ELECTROCHEMISTRY-Follow-up Test 7
- Measurement of the coonductivity of electrolytic solutions is done wit...
Text Solution
|
- A conductivity cell is platinized to
Text Solution
|
- The cell constant of a conductivity cell is usually determined by meas...
Text Solution
|
- Which of the following is correct regarding the variation of conductiv...
Text Solution
|
- Which of the following increases with dilution?
Text Solution
|
- Which of the following plots represents correctly the variation of con...
Text Solution
|
- Which of the following plots represents correctly the variation of mol...
Text Solution
|
- Which of the following equations corrects the molar conductivity with ...
Text Solution
|
- According to Kohlrausch law, the limiting molar conductivity of an ele...
Text Solution
|
- At infinite dilution the ionic condutanc is maximum for
Text Solution
|
- The unit of ionic mobility are
Text Solution
|
- The conductivity of a saturated solution of AgCl at 25^(@)C after subt...
Text Solution
|