


CP SINGH-MOTION IN A STRAIGHT LINE-EXERCISES
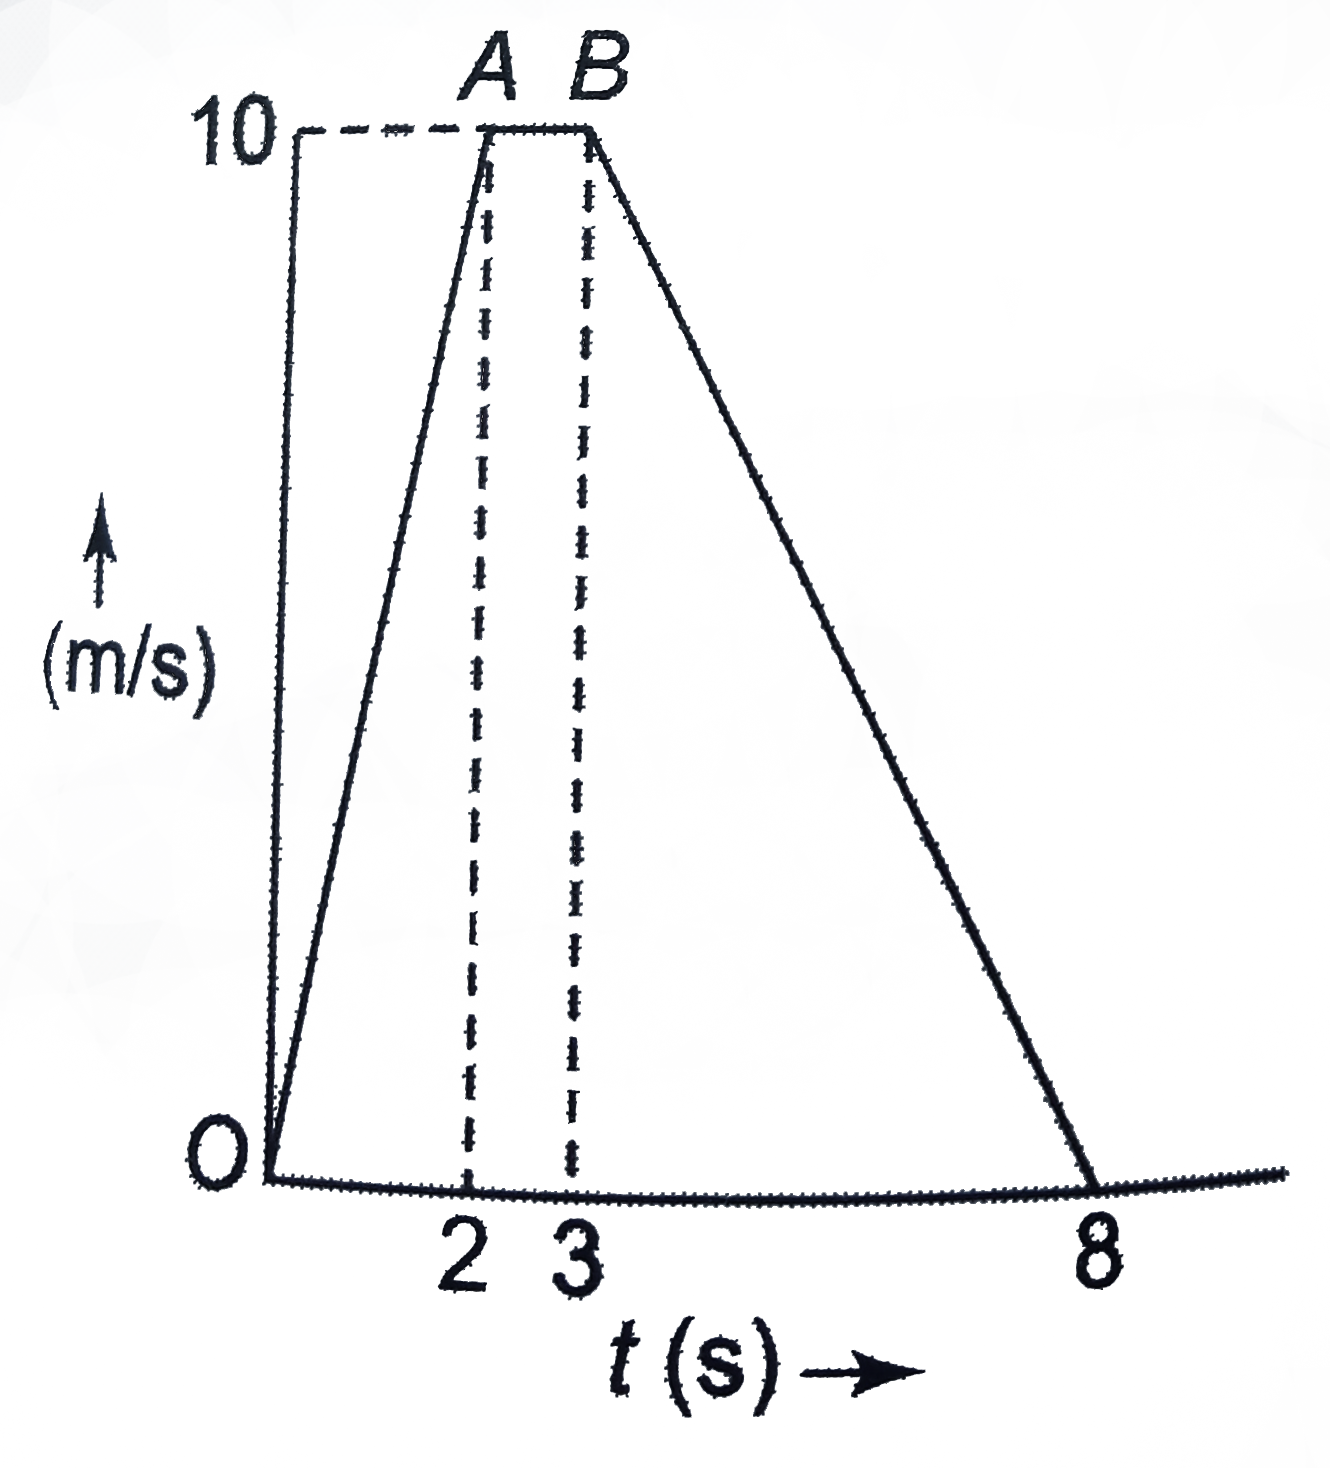
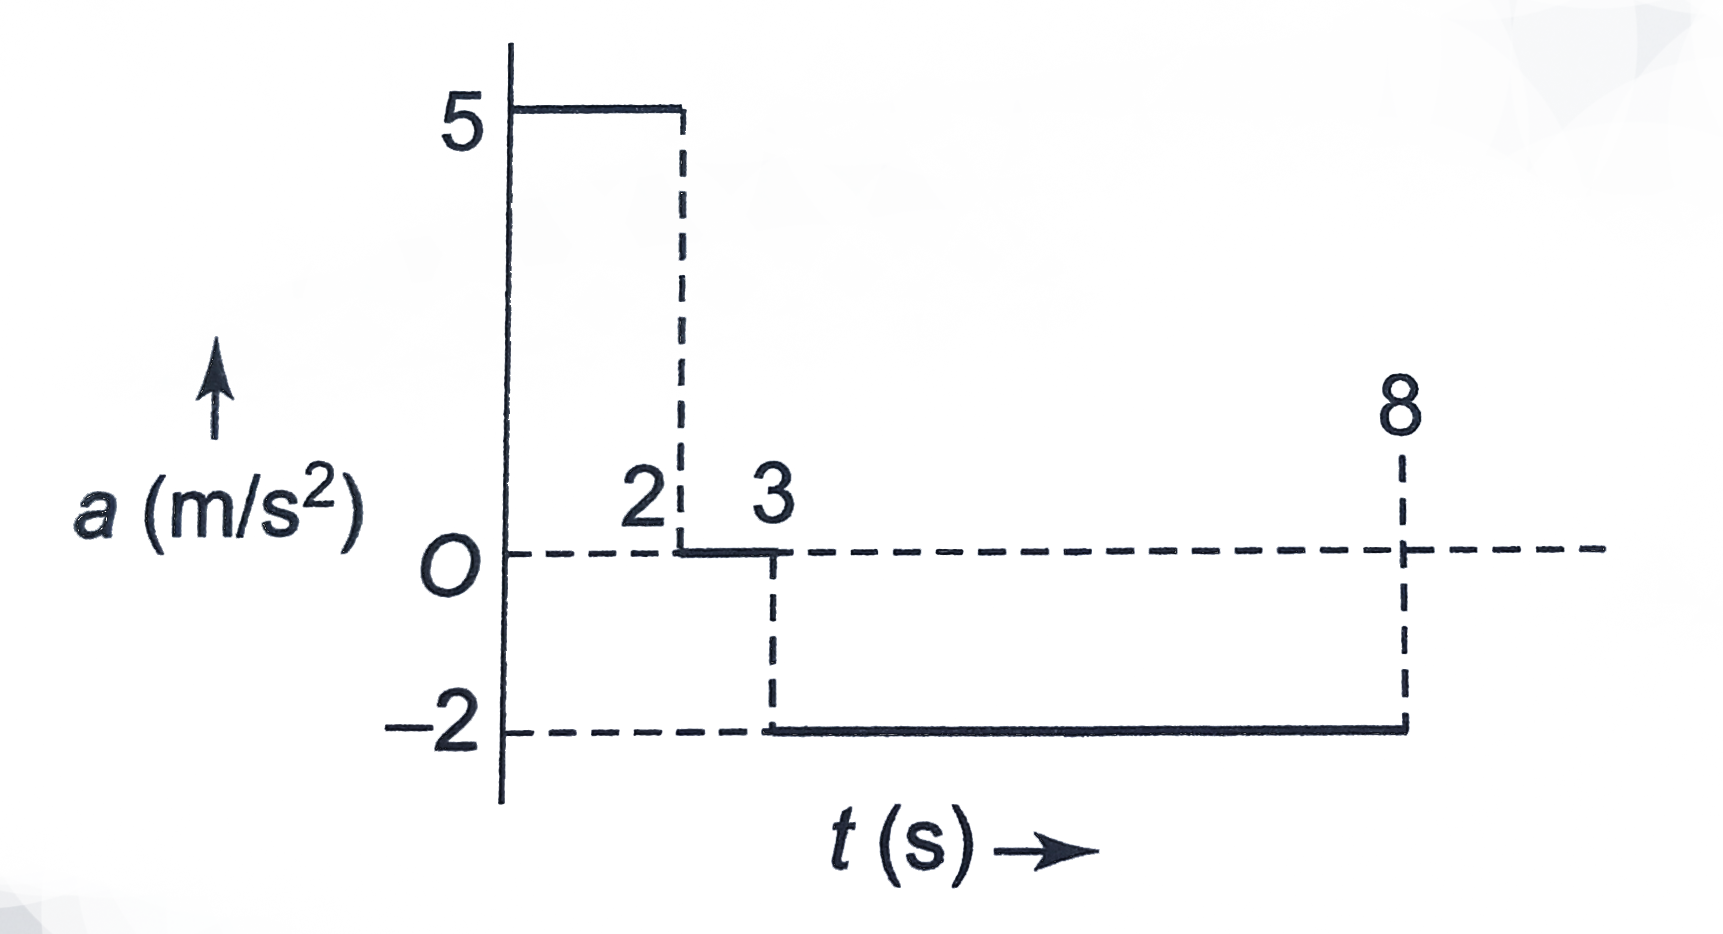
- For a particle moving in a straight line, the velocity-time graph is a...
Text Solution
|
- The ratio of the numerical values of the average velocity and average ...
Text Solution
|
- Which of the following is a one-dimensional motion ?
Text Solution
|
- A point traversed half a circle of radius r during a time interval t(0...
Text Solution
|
- A particle moves 3 m north, then 4 m east, and then 12 m vertically up...
Text Solution
|
- A person travelling on a straight line moves with a uniform velocity v...
Text Solution
|
- A car moves from X to Y with a uniform speed vu and returns to Y with ...
Text Solution
|
- A particle moves in a straight line from A to B (a) for the first ha...
Text Solution
|
- If a car covers (2)/(5)^(th) of the total distance with v1 speed and (...
Text Solution
|
- A car travels half the distance with a constant velocity of 40 m//s an...
Text Solution
|
- One car moving on a staright road covers one-third of the distance wit...
Text Solution
|
- A particle moving in a straight line covers half the distance with spe...
Text Solution
|
- A body starts from rest. What is the retio of the distance traveled by...
Text Solution
|
- A partical is moving in a straight line under constant acceletation. I...
Text Solution
|
- A particle is moving in a straight line under constant acceleration of...
Text Solution
|
- A body is moving with a uniform acceleration coverss 40 m in the first...
Text Solution
|
- A particle starts its motion from rest under the action of a constant ...
Text Solution
|
- A body travels for 15 s starting from rest with a constant acceleratio...
Text Solution
|
- A body moving with a uniform acceleration crosses a distance of 15 m i...
Text Solution
|
- A 150 m long train is moving with a uniform velocity of 45 km//h. The ...
Text Solution
|
- Speeds of two identical cars are u and 4u at at specific instant. The ...
Text Solution
|