A
B
C
D
Text Solution
AI Generated Solution
The correct Answer is:
Topper's Solved these Questions
Similar Questions
Explore conceptually related problems
RESONANCE-CALORIMETRY-Exercise
- The amount of heat required to change the state of 1 kg of substance a...
Text Solution
|
- The water equivatent of a 400 g copper calorimeter (specific heat =0.1...
Text Solution
|
- Heat required to convert 1 g of ice at 0^(@)C into steam at 100 ^(@)C ...
Text Solution
|
- The thermal capacity of 40 g of aluminium (specific heat =0.2 cal//gm^...
Text Solution
|
- Boiling water is changing into steam. Under this condition the specifi...
Text Solution
|
- One kg of ice at 0^(@)C is mixed with 1 kg of water at 10^(@)C. The re...
Text Solution
|
- A metallic ball and highly stretched spring are made of the same mater...
Text Solution
|
- If a bimetallic strip is heated it will
Text Solution
|
- Two holes of unequal diameters d(1) and d(2)(d(1)gt d(2)) are cut in m...
Text Solution
|
- A metallic bar is heated from 0^(@)C to 100^(@)C. The coefficient of l...
Text Solution
|
- A pendulum clock has an iron pendulum 1 m long (alpha("iron")=10^(-5) ...
Text Solution
|
- If the length of a cylinder on heating increases by 2%, the area of it...
Text Solution
|
- The volume of a solid decreases by 0.6% when it is cooled through 50^(...
Text Solution
|
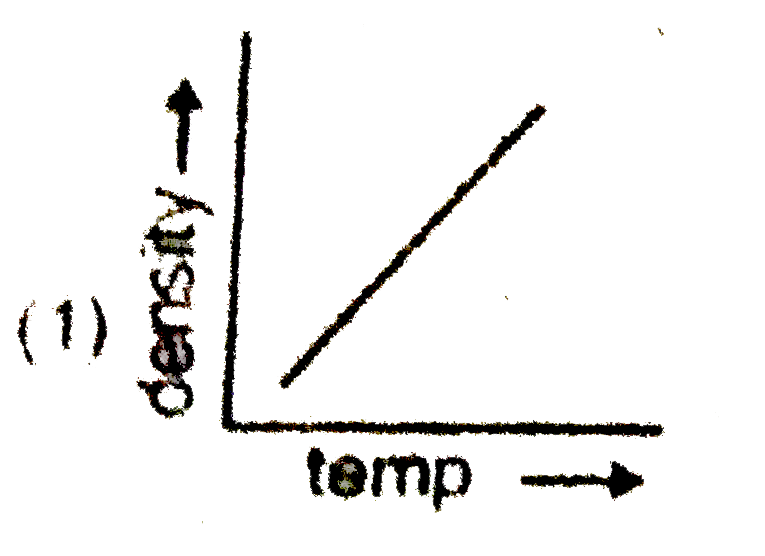
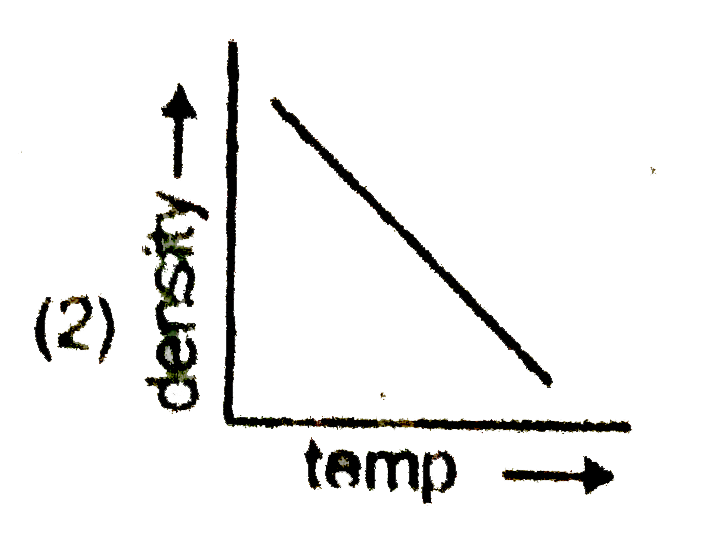
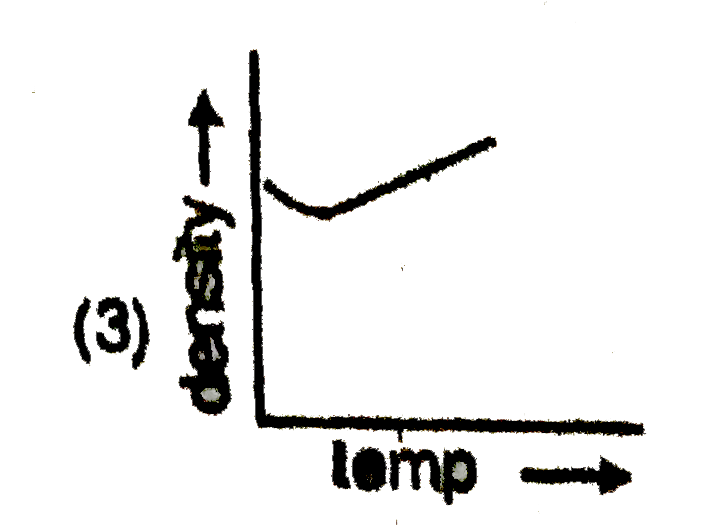
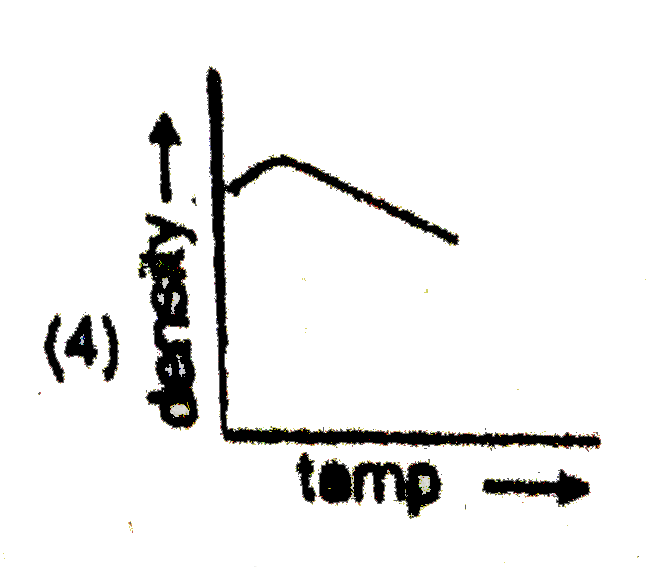
- Which of the following curve represent variation of density of water w...
Text Solution
|
- A rectangular block is heated from 0^(@)C to 100^(@)C. The percentage ...
Text Solution
|
- A thin copper wire of length l increases in length by 1% when heated f...
Text Solution
|
- A liquid with coefficient of volume expansion gamma is filled in a con...
Text Solution
|
- A different of temperature of 25^(@)C is equivalent to a difference of
Text Solution
|
- Statement-1: Gas thermometers are more sensitive than liquid thermomet...
Text Solution
|


