A
B
C
D
Text Solution
Verified by Experts
The correct Answer is:


Topper's Solved these Questions
Similar Questions
Explore conceptually related problems
ALLEN-TEST PAPER-Exercise (Physics)
- which of the following forces can never, under any circumstances, does...
Text Solution
|
- A body (intially at rest is falling under gravity. When it loses a gra...
Text Solution
|
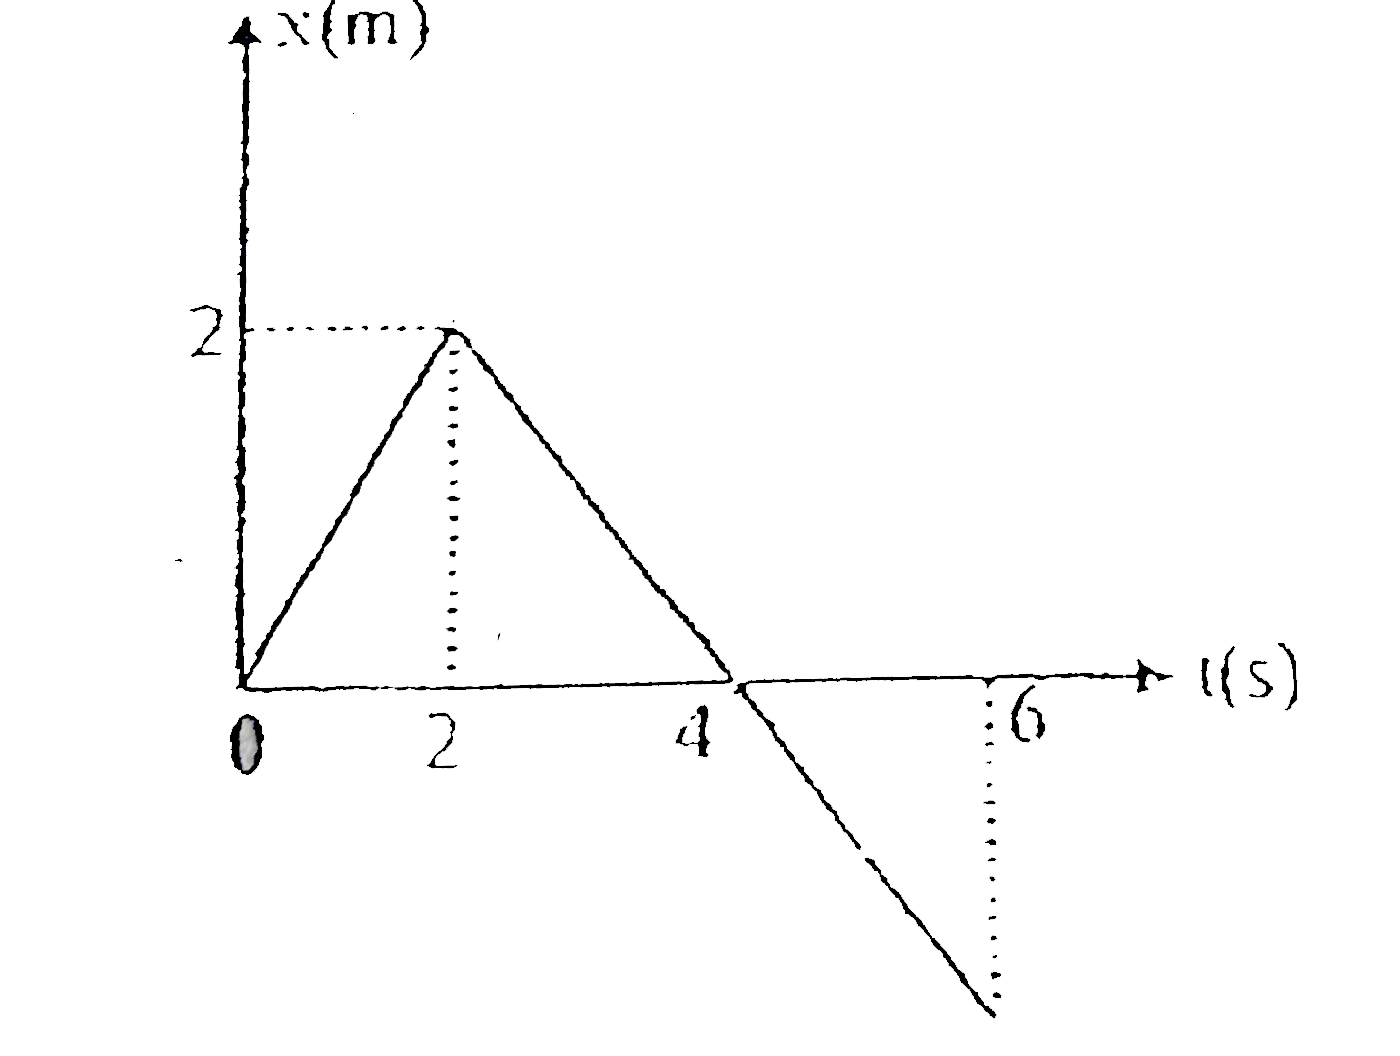
- Position time graph of a particle of mass 2 kg is shown in figrure. To...
Text Solution
|
- A block of mass m lies on a horizontal frictionless surface and is att...
Text Solution
|
- Block A of mass 1 kg is placed on the rough surface of block B of mass...
Text Solution
|
- One end of a light spring of natural length 4m and spring constant 170...
Text Solution
|
- A particle of mass 1 kg moves in a circular path of radius 1 m such th...
Text Solution
|
- Infinite rods of uniform mass density and length L,L/2,L/4….. Are plac...
Text Solution
|
- A semicircular lamina of mass m and radius r and centre C. Its center ...
Text Solution
|
- The position vector of a particle in a circular motion about the origi...
Text Solution
|
- The maximum tension in the string of a pendulum is three times the min...
Text Solution
|
- A body of radius R and mass m is rolling smoothly with speed v on a ho...
Text Solution
|
- The figure shows a uniform rod lying along the x-axis. The locus of al...
Text Solution
|
- Same number of books are placed in four books cases as shown. Which lo...
Text Solution
|
- A hollow smooth uniform A of mass 'm' rolls without sliding on a smoot...
Text Solution
|
- In an experiment with a beam balance an unknown mass m is balanced by ...
Text Solution
|
- A fixed pulley of radius 20 cm and moment of inertia 0.32 kg.m^(2) abo...
Text Solution
|
- Figures 1 and 2 below show a meter stick, haif of which is wood and ha...
Text Solution
|
- A sphere of mass M and radius r slips on a rough horizontal plane. At ...
Text Solution
|
- A 1 Kg solid sphere rolls without slipping on a rough horizontal sufac...
Text Solution
|