Home
Class 9
MATHS
Prepare a continuous grouped frequency d...

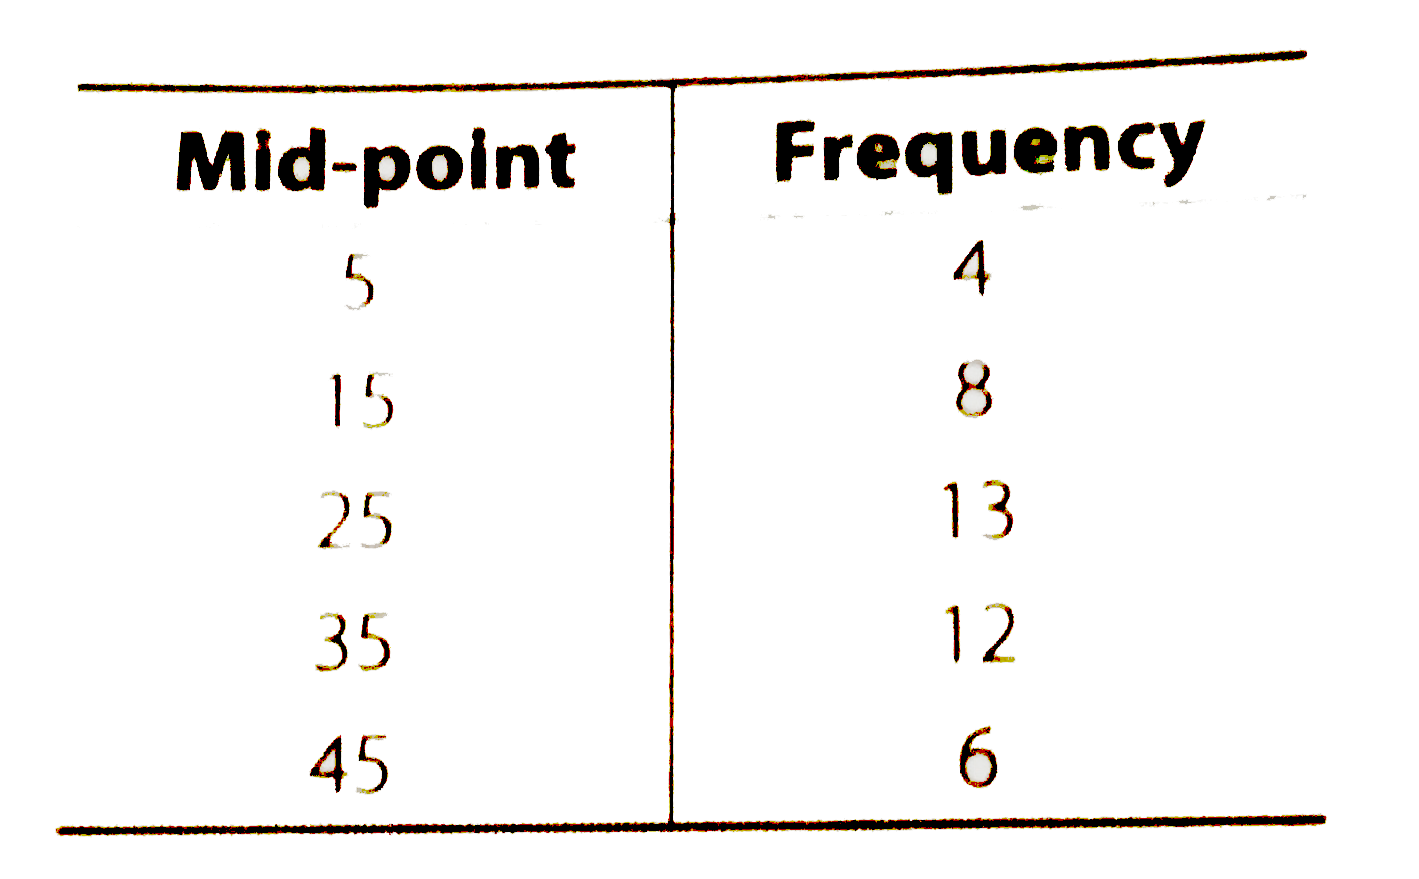
Prepare a continuous grouped frequency distribution from the following data

Also, find the size of class intervals.

Text Solution

Verified by Experts

Here, we see that the difference between two mid-points is 15-5 i.e., 10.
It means the width of the class interval is 10.
Let the lower limit of the first class interval be a.
Then, its upper limit =a+10
Now, mid value of the first class interval =5
`rArr "Mid value"=("Lower limit"+"Upper limit")/(2)`
`rArr 5=(a+a+10)/(2) rArr 2a+10=10`
`rArr 2a=0 rArr a=0`
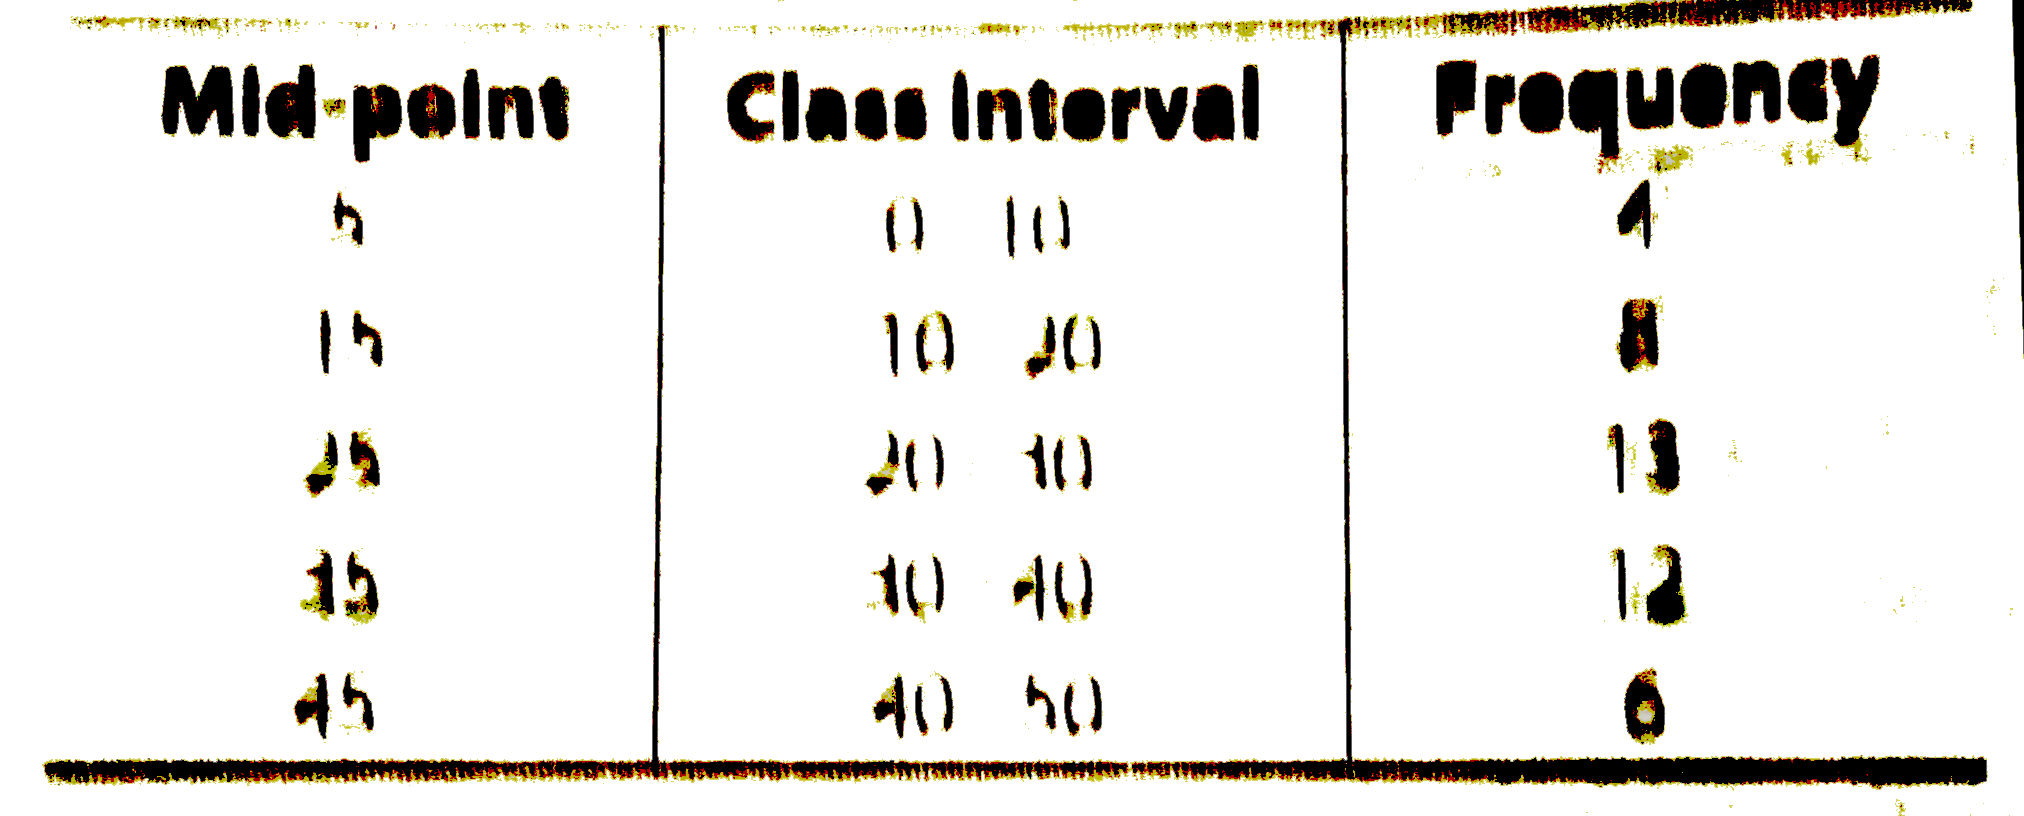
So, the first class interval is 0-10.
Now, we prepare a continous grouped frequency distribution table is given below

Hence, the size of the class interval is 10 i.e., 10-0.
Doubtnut Promotions Banner Mobile Dark
|

Topper's Solved these Questions

  • STATISTICS AND PROBABILITY

    NCERT EXEMPLAR|Exercise LONG ANSWER TYPE QUESTIONS|5 Videos
  • QUADRILATERALS

    NCERT EXEMPLAR|Exercise Quadrilaterals|56 Videos
  • TRIANGLES

    NCERT EXEMPLAR|Exercise Triangles|55 Videos

Similar Questions

Explore conceptually related problems

Continuous or grouped frequency distribution.

From the frequency distribution table from the following data

Draw a histogram for the frequency distribution of the following data:

Draw a histogram for the frequency distribution of the following data:

Median of grouped or continuous frequency distribution

Drawing the histogram of a continuous grouped frequency distribution.

Continuous or Grouped Frequency Distribution - (a) Exclusive Method

Prepare histogram and frequency polygon from the following data :

Mean of Grouped Data or discrete frequency distribution

Make a frequency distribution (inclusive ) series of the following data. The class interval is to be taken as 6.