Home
Class 12
PHYSICS
The graph between the energy of p...

The graph between the energy of photoelectrons E and the wavelength of incident light ` (lamda ) ` is

A

B

C

D

Text Solution

AI Generated Solution

The correct Answer is:
To solve the question regarding the graph between the energy of photoelectrons \( E \) and the wavelength of incident light \( \lambda \), we will follow these steps: ### Step 1: Understand the Relationship According to Planck's quantum theory, the energy \( E \) of a photon is directly proportional to its frequency \( \nu \): \[ E \propto \nu \] We can express frequency in terms of wavelength: \[ \nu = \frac{c}{\lambda} \] where \( c \) is the speed of light. Thus, we can rewrite the energy equation as: \[ E = h \nu = \frac{hc}{\lambda} \] where \( h \) is Planck's constant. ### Step 2: Analyze the Equation From the equation \( E = \frac{hc}{\lambda} \), we can see that: - \( h \) and \( c \) are constants. - This implies that energy \( E \) is inversely proportional to the wavelength \( \lambda \): \[ E \propto \frac{1}{\lambda} \] ### Step 3: Determine the Graph Shape Since \( E \) is inversely proportional to \( \lambda \), we can express this relationship as: \[ E \cdot \lambda = hc \] This indicates that the product of energy and wavelength is a constant, which is characteristic of a hyperbolic relationship. ### Step 4: Sketch the Graph 1. On the y-axis, plot the energy \( E \). 2. On the x-axis, plot the wavelength \( \lambda \). 3. As \( \lambda \) approaches zero, \( E \) approaches infinity. Conversely, as \( \lambda \) increases, \( E \) decreases. 4. The graph will be a hyperbola that approaches the axes but never touches them. ### Conclusion The graph between the energy of photoelectrons \( E \) and the wavelength of incident light \( \lambda \) is a hyperbola.
Promotional Banner

Topper's Solved these Questions

  • PHOTOELECTRIC EFFECT

    MOTION|Exercise EXERCISE-2 (OBJECTIVE QUESTIONS (NEET))|17 Videos
  • PHOTOELECTRIC EFFECT

    MOTION|Exercise EXERCISE - 3 SECTION -A (Previous Year Problems (NEET ))|38 Videos
  • PHOTOELECTRIC EFFECT

    MOTION|Exercise QUESTIONS FOR PRACTICE|12 Videos
  • OPTICS

    MOTION|Exercise Exercise|45 Videos
  • PROJECTILE MOTION

    MOTION|Exercise EXERCISE-3 (SECTION-B)|8 Videos

Similar Questions

Explore conceptually related problems

The correct graph between the maximum energy of a photoelectron and the inverse of wavelength of the incident radiation is given by the curve

According to Einstein's photoelectric equation , the graph between the kinetic energy of photoelectrons ejected and the frequency of incident radiation is

According to Einstein's photoelectric equation, the graph between kinetic energy of photoelectrons ejected and the frequency of the incident radiation is :

Maximum kinetic energy of a photoelectron is E when the wavelength of incident light is lambda . If energy becomes four times when wavelength is reduced to one thrid, then work function of the metal is

The correct graph respectivley the relation between energy (E ) of photoelectrons and frequency v of incident light is

What is the effect on the velocity of emitted photoelectrons if the wavelength of the incident light is increased ?

What is the effect on the velocity of the emitted photoelectrons if the wavelength of the incident light is decreased ?

Assertion : The kinetic energy of a photoelectron decrease with increases with increase in the wavelength of incident light. Reason : All photoelectrons are not emitted with the same speed because of the range of wavelength in the white light.

If light of wavelength lambda_(1) is allowed to fall on a metal , then kinetic energy of photoelectrons emitted is E_(1) . If wavelength of light changes to lambda_(2) then kinetic energy of electrons changes to E_(2) . Then work function of the metal is

MOTION-PHOTOELECTRIC EFFECT -EXERCISE-1 (OBJECTIVE QUESTIONS)
  1. Light of wavelength 3320 Å incidents on metal surface (work fun...

    Text Solution

    |

  2. Using light of wavelength 6000 Å stopping potential is obtained ...

    Text Solution

    |

  3. When light source is placed at 1 m distant from photo electric...

    Text Solution

    |

  4. In the given diagram if V represent the stopping potential and...

    Text Solution

    |

  5. Photoelectric current as a function of voltage V for different ...

    Text Solution

    |

  6. In the following figure the curves have been drawn between the...

    Text Solution

    |

  7. When monochromatic light of wavelength lambda illuminates a metal surf...

    Text Solution

    |

  8. If the wavelength of incident light decrease from lamda 1 ...

    Text Solution

    |

  9. The retarding potential for having zero photo - electron current

    Text Solution

    |

  10. In photoelectric effect work function of any metal is 2.5 eV. ...

    Text Solution

    |

  11. When ultraviolet light of wavelength 100 nm is incident upon silver pl...

    Text Solution

    |

  12. Slope of V(0) vs v curve is (where V(0)= Stopping potential, v=subject...

    Text Solution

    |

  13. Figure represents the graph of photo current I versus applied ...

    Text Solution

    |

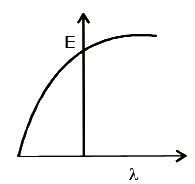
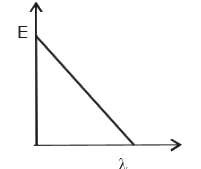
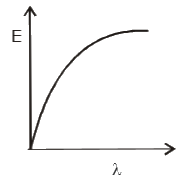
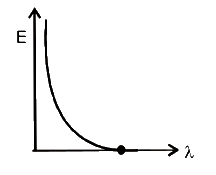
  14. The graph between the energy of photoelectrons E and the wav...

    Text Solution

    |

  15. In the diagram, graph are drawn between stopping potential ...

    Text Solution

    |

  16. For a photoelectric cell, the graph shown the variation of c...

    Text Solution

    |

  17. A monochromatic source of light operation at 200 W emits 4xx10^(20) ph...

    Text Solution

    |

  18. Light of wavelength 5000 Å falls on a sensitive surface. If th...

    Text Solution

    |

  19. In photoelectric equation hv = hv 0 + (1 )/(2) mv ^ 2 of Ei...

    Text Solution

    |

  20. the photoelectric effect can not be explained by the wave theory of li...

    Text Solution

    |