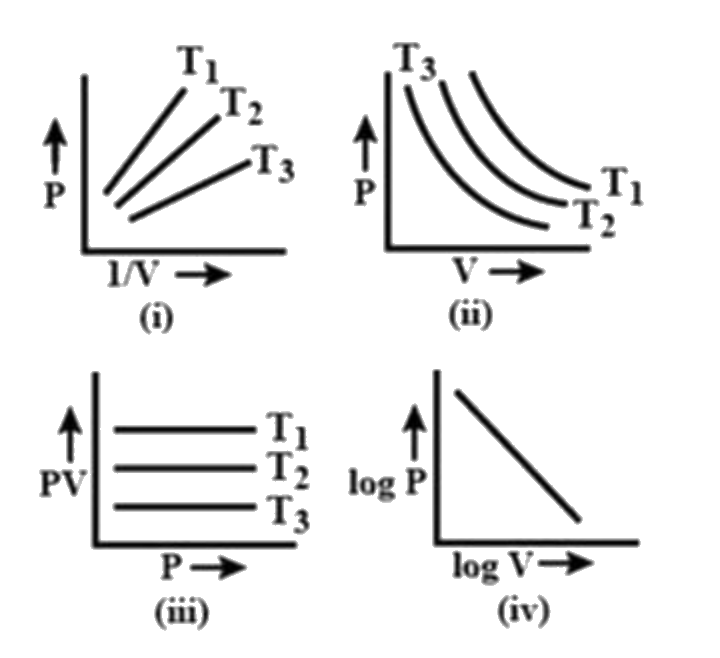
A
B
C
D
Text Solution
Verified by Experts
The correct Answer is:
Topper's Solved these Questions
Similar Questions
Explore conceptually related problems
NTA MOCK TESTS-NTA JEE MOCK TEST 62-CHEMISTRY
- The following data were obtained during the first order thermal decomp...
Text Solution
|
- The chemical composition of slag formed during the smelting process in...
Text Solution
|
- Benzene carbaldehyde is reacted with concentrated NaOH solution, to g...
Text Solution
|
- Identify the correct pathway to convert propanoic acid to ethylamine. ...
Text Solution
|
- The abstraction of proton will be fatest from which carbon in the foll...
Text Solution
|
- Most of the transition metals exhibit (i) paramagnetic behaviour ...
Text Solution
|
- On treatment of 10 ml of 1M solution of the complex CrCl(3).6H(2)O wit...
Text Solution
|
- Match the columns I, II and III and mark the appropriate choice.
Text Solution
|
- Given below are two reactions of water with sodium and carbon dioxide....
Text Solution
|
- The edge length of sodium chloride unit cell is 564 pm. If the size of...
Text Solution
|
- Decreasing order of stability of following alkenes is (i) CH(3)-cH=...
Text Solution
|
- Study the orbital diagrams of two atoms 'X and Y'. Which subshell will...
Text Solution
|
- Study of the following names of the organic compounds is not correctly...
Text Solution
|
- The decreasing order of boiling points of the following alcohols is
Text Solution
|
- Graph between pressure and volume are plotted at different temperature...
Text Solution
|
- How many litres of water must be added to 1 L of an aqueous solution o...
Text Solution
|
- Consider the equations given below and find the sum of x, y and z. (...
Text Solution
|
- A system changes from state X to Y with a change in internal energy me...
Text Solution
|
- When a gas is bubbled through water at 298 K, a very dilute solution o...
Text Solution
|
- How many of the following groups are ortho,para directing and ring act...
Text Solution
|
