Home
Class 11
ECONOMICS
Find the missing frequency in the follow...

Find the missing frequency in the following distribution if N=100 and M=30.
`{:("Marks",0-10,10-20,20-30,30-40,40-50,50-60),("Number of Students"," "10," "?," "25," "30," "?," "10):}`

Text Solution

Verified by Experts

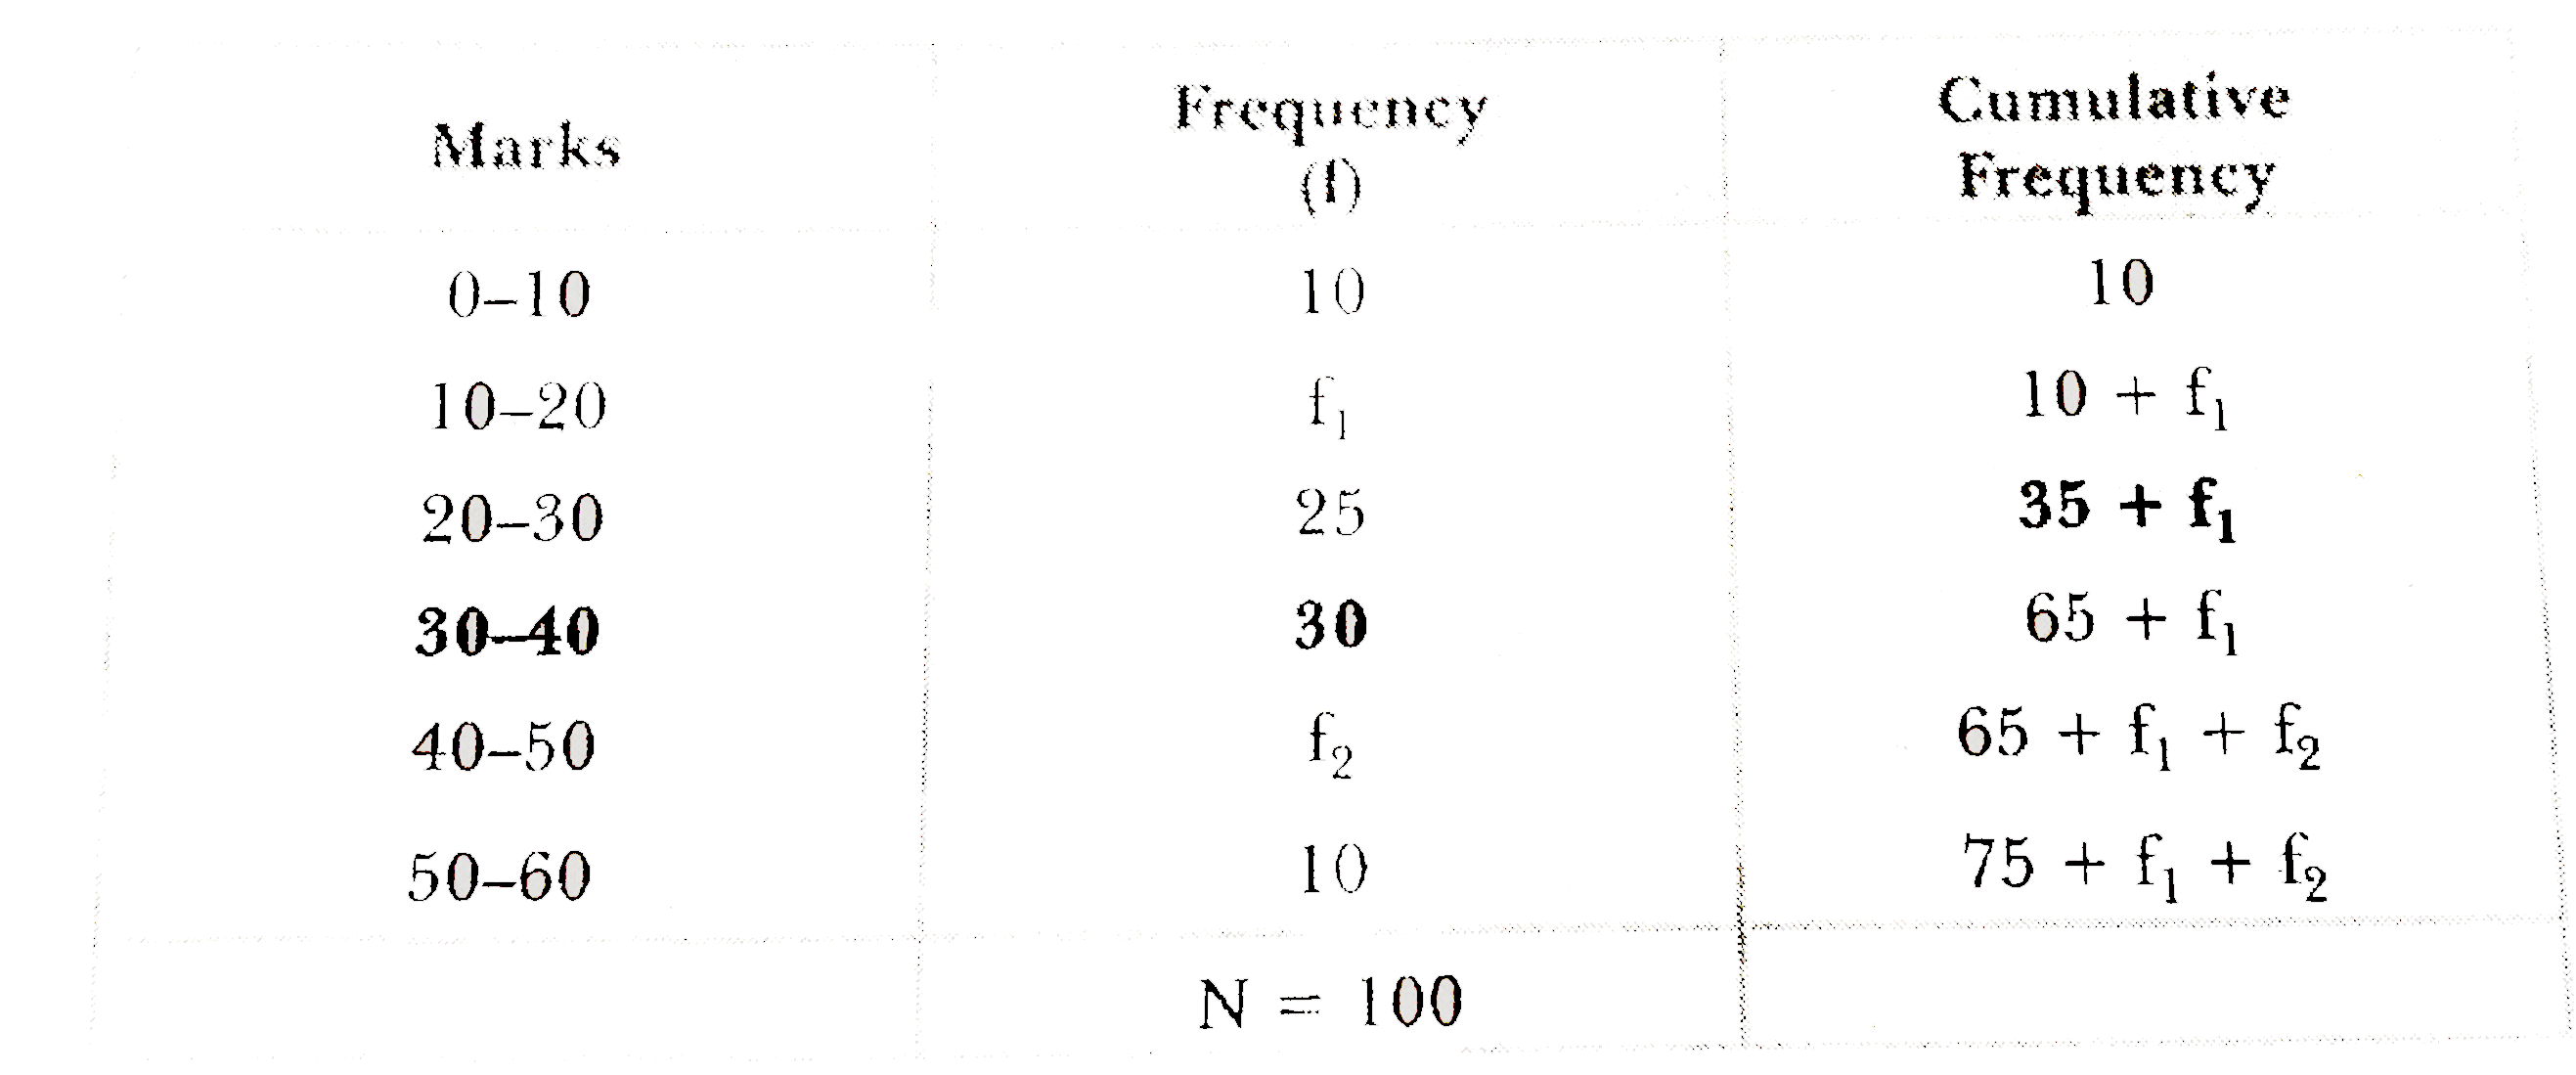
Two frequencies are missing and let the missing frequencies be denoted by `f_(1)and f_(2)` . We need two equations , we will get one from summation of frequencies and one from median formula.

1 st Equation : From summation of frequencies,
`75+f_(1)+f_(2)=100rArrf_(1)+f_(2)=25` ...(i)
2nd Equation : From onformation regarding median ,
M=30, Median class is 30-40 . Now
`M=l_(1)+(N/(2)-c.f.)/(f)xxi`
`30=30+(50-(35+f_(1)))/(30)xx10`
`0=(15-f_(1))/(3)orf_(1)=15` ...(ii)
Substituting `f_(1)`= 15 from equation (ii),in equation (i)
As `f_(1)+f_(2)=25`
Put `f_(1)=15`
`:.15+f_(2)=25`
`:. f_(2)=25-15=10`
Thus , `f_(1)=15,f_(2)=10`.
Doubtnut Promotions Banner Mobile Dark
|

Topper's Solved these Questions

  • MEASURES OF CENTRAL TENDENCY MEDIAN AND MODE

    TARUN JAIN & VK OHRI|Exercise Miscellaneous Illustrations|30 Videos
  • MEASURES OF CENTRAL TENDENCY MEDIAN AND MODE

    TARUN JAIN & VK OHRI|Exercise Objective Type Questios|26 Videos
  • MEASURES OF CENTRAL TENDENCY - ARITHMETIC MEAN

    TARUN JAIN & VK OHRI|Exercise Illustration|72 Videos
  • MEASURES OF DISPERSION

    TARUN JAIN & VK OHRI|Exercise Learning by doing|30 Videos

Similar Questions

Explore conceptually related problems

Find the value of frequecies in the following frequency distribution table, if n=100 and median is 32 [[Marks,0-10,10-20,20-30,30-40,40-50,50-60,Total],[Number of student,10,x,25,30,y,10,100]]

Find out median marks from the following data : {:("Marks",0-10,10-20,20-30,30-40,40-50),("Number of Students"," "8," "30," "40," "12," "10):}

Locate the median graphically from the following data : {:("Marks",0-10,10-20,20-30,30-40,40-50),("Number of Students"," "10," " 20," " 30," " 20," " 10):}

Caculate the median and mode from the following data : {:("Marks",0-10,10-20,20-30,30-40,40-50,50-60,60-70,70-80),("Number of Students"," "2," "18," "30," "45," "35," "20," "6," "3):}

Obtain the mean , median and mode of the following data : {:("Marks",0-10,10-20,20-30,30-40,40-50,50-60,60-70,70-80),("Number of Students"," "5," "7," "15," "25," "20," "15," "8," "5):}

Calculate median of the following of data : {:("Class Interval",0-5,5-10,10-20,20-30,30-50,50-70,70-100),("Number of Students"," "12," "15," "25," "40," "42," "14," "8):}

Caculate mode of the following data : {:("Marks",0-5,5-10,10-20,20-40,40-60,60-80,80-90,90-100),("Number of Students"," "5," "7," "9," "25" "," "30," "24," "8," "6):}

Given the following data , find out median : {:("Age",20-25,25-30,30-35,35-40,40-45,45-50,50-55,55-60),("Number of Students"," "50," "70," "100," "180," "150," "120," "70," "60):}

Find out median value of the following distribution: {:("Wege Rate (Rs.)",0-10,10-20,20-30,30-40,40-50),("Number of Workers", " "22," "38," "46," "35," "20):}

Determine median value of the following series using graphic method : {:("Marks",0-5,5-10,10-15,15-20,20-25,25-30,30-35,35-40),("Number of students"," "4," "6," "10," "10," "22," "25," "18," "5):}