


KCET PREVIOUS YEAR PAPERS-KARNATAKA CET 2012-PHYSICS
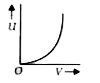
- Which of the following graphs correctly represents the variation of h...
Text Solution
|
- A current of 2 A is passing through a metal wire of cross sectional ar...
Text Solution
|
- Magnetic field at a distance r from an infinitely long straight conduc...
Text Solution
|
- In the loop shown , the magnetic induction at the point 'O' is
Text Solution
|
- An alpha - particle and a proton moving with the same kinetic energy e...
Text Solution
|
- Direction of current induced in a wire moving in a magnetic field is f...
Text Solution
|
- An ideal resistance R, ideal inductance L , ideal capacitance C and AC...
Text Solution
|
- X- rays, gamma rays and microwaves travelling in vacuum have
Text Solution
|
- If n is the orbit number of the electron in a hydrogen atom , the corr...
Text Solution
|
- In a Ruby laser , the colour of laser light is due to ………… atom .
Text Solution
|
- The radius of ""(29) Cu^(64) nucleus in Fermi is (given R(0) = 1.2 xx ...
Text Solution
|
- In a radioactive decay , an element ""(Z) X^(A) emits four alpha- part...
Text Solution
|
- For a transistor , beta = 100 . The value of alpha is
Text Solution
|
- The following truth table with A and B as inputs is for ………., gate .
Text Solution
|
- n photons of wavelength lambda are absorbed by a black body of mass m ...
Text Solution
|
- A radioactive nucleus has specific binding energy 'E(1)' . It emits an...
Text Solution
|
- The dimensional formula of physical quantity is M^(a) L^(b) T^( c) . T...
Text Solution
|
- A person throws balls into air vertically upward in regular intervals ...
Text Solution
|
- The circular motion of a particle with constant speed is
Text Solution
|
- A planet moving around sun sweeps area A(1) in 2 days , A(2) in 3 day...
Text Solution
|