Text Solution
Verified by Experts


Topper's Solved these Questions
Similar Questions
Explore conceptually related problems
U-LIKE SERIES-EXAMINATION PAPER 2020-SECTION D
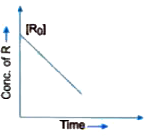
- Visha plotted a graph between concentration of R and time for a reacti...
Text Solution
|
- A first order reaction takes 25 minutes for 25% decomposition. Calcula...
Text Solution
|
- The rate constant for a first order reaction is "60 s"^(-1). How much ...
Text Solution
|
- Write two factors that affect the rate of a chemical reaction.
Text Solution
|
- Write two conditions for the collisions to be effective collisions.
Text Solution
|
- An amorphous solid 'A' which has a crown shaped structure, burns in ai...
Text Solution
|
- An amorphous solid 'A' which has a crown shaped structure, burns in ai...
Text Solution
|
- An amorphous solid 'A' which has a crown shaped structure, burns in ai...
Text Solution
|
- Give reasons for the following observations : (i) Halogens are stron...
Text Solution
|
- Complete and balance the following chemical equations : (i) underset...
Text Solution
|
- An organic compound 'A' having molecular formula C(5)H(10)O gives nega...
Text Solution
|
- Carry out the following conversions : (i) Propanoic acid to 2-Bromop...
Text Solution
|
- How will you distinguish between benzaldehyde and acetadehyde ?
Text Solution
|
- Complete the following sequence of reactions : CH(3)COCH(3)overset(B...
Text Solution
|
- How can you distinguish between : (i) Ethanol and Propanone, and (...
Text Solution
|