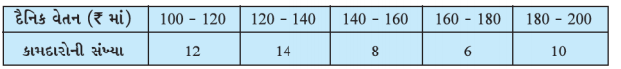
The following distribution gives the daily income of 50 workers of a factory. Convert the distribution above to a less than type cumulative frequency distribution, and drawn its ogive.
Text Solution
Verified by Experts
The correct Answer is:
`(##NCERT_GUJ_MAT_X_C14_E04_001_A01##)` Draw ogive by plotting the points : (300,12) ,(350,26) ,(350,26) ,(400,34) , (450,40) ,(500,50)
Topper's Solved these Questions
STATISTICS
NCERT GUJARATI|Exercise Do this|3 Videos
STATISTICS
NCERT GUJARATI|Exercise THINK AND DISCUSS|8 Videos
STATISTICS
NCERT GUJARATI|Exercise Exercise 14.3|7 Videos
SIMILAR TRIANGLES
NCERT GUJARATI|Exercise TRY THIS|6 Videos
TANGENTS AND SECANTS TO A CIRCLE
NCERT GUJARATI|Exercise Try this|2 Videos
Similar Questions
Explore conceptually related problems
The following table gives production yield per hectare of wheat of 100 farms of a village. Change the distribution to a more than type distribution , and draw its ogive.
Let us now consider the following frequency distribution table which gives the weights of 38 students of a class : Convert the classes of above frequency distribution to continuous classes to include two new students weighing 35.5 kg and 40.5 kg.
The following distribution shows the daily pocket allowance of children of a locality . The mean pocket allowance is ₹ 18. Find the missing frequency f. {:("Daily pocket allowance (in ₹) ",11-13,13-15,15-17,17-19,19-21,21-23,23-25),("Number of children "," "7," "6," "9," "13," "f," "5," "4):}
The distance (in km) of 40 engineers from their residence to their place of work were found as follows : Construct a grouped frequency distribution table with class size 5 for the data given above taking the first interval as 0-5 (5 not included). What main features do you observe from this tabular representation ?
Three coins are tossed 30 times simultaneously. Each time the number of heads occurring was noted down as follows: Prepare a frequency distribution table for the data given above.