A
B
C
D
Text Solution
Verified by Experts
The correct Answer is:


Topper's Solved these Questions
CHEMICAL THERMODYNAMICS
AAKASH SERIES|Exercise Practice Sheet- Exercise-IV|20 VideosCHEMICAL THERMODYNAMICS
AAKASH SERIES|Exercise Additional Practice Exercise|54 VideosCHEMICAL THERMODYNAMICS
AAKASH SERIES|Exercise Practice Sheet- Exercise-II|30 VideosCHEMICAL KINETICS
AAKASH SERIES|Exercise Objective Exercise - 4 (Assertion (A) & Reason (R) Type Questions)|44 VideosCHEMISTRY IN EVERY DAY LIFE
AAKASH SERIES|Exercise PRACTICE EXERCISE|29 Videos
Similar Questions
Explore conceptually related problems
AAKASH SERIES-CHEMICAL THERMODYNAMICS-Practice Sheet- Exercise-III
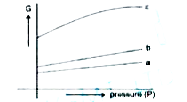
- The following curve represents the variation of Gibbs function 'G' wit...
Text Solution
|
- Which correctly represents the entropy (s) of an isolated system durin...
Text Solution
|
- At 1000K water vapour at 1 atm. Has been found to be dissociated into ...
Text Solution
|
- For which process will DH^(@) and DG^(@) be expected to be most simila...
Text Solution
|
- Statement-I: At low temperature, DH is the dominant factor for spontan...
Text Solution
|
- For which process will DH^(@) and DG^(@) be expected to be most simila...
Text Solution
|
- Pick out the correct statement from among the four:
Text Solution
|
- For a reaction, A(2) + B(2) hArr 2AB, DeltaG and DeltaS values are 20 ...
Text Solution
|
- Statement-I Due to adiabatic free expansion, temperature of a real gas...
Text Solution
|
- Which of the following process has negative value of DeltaS?
Text Solution
|
- Some statements are given with regard to entropy. The incorrect statem...
Text Solution
|
- 2H(2(g)) + O(2(g)) rarr 2H(2)O((l)) , DeltaH= -ve and DeltaG= -ve. The...
Text Solution
|
- Based on the third law of themodynamics, the entropy can be obtained u...
Text Solution
|
- When charcoal burns in air signs of DeltaH and DeltaS "are " 2C((s)) +...
Text Solution
|
- DeltaS("surr") " for " H(2) + 1//2O(2) rarr H(2)O, DeltaH -280 kJ at 4...
Text Solution
|
- The direct conversion of A to B is difficult, hence it is carried out ...
Text Solution
|
- The incorrect statement according to second law of themodynamics is
Text Solution
|
- Entropy of a system depends upon
Text Solution
|
- Which processes involve increase in entropy?
Text Solution
|
- Which statements are correct as per laws of thermodynamics?
Text Solution
|