Text Solution
Verified by Experts


Topper's Solved these Questions
ATOMS
U-LIKE SERIES|Exercise LONG ANSWER QUESTIONS - I|18 VideosATOMS
U-LIKE SERIES|Exercise LONG ANSWER QUESTIONS - II|4 VideosATOMS
U-LIKE SERIES|Exercise VERY SHORT ANSWER QUESTIONS.|20 VideosALTERNATING CURRENT
U-LIKE SERIES|Exercise SELF ASSESSMENT TEST (SECTION -C)|2 VideosCBSE EXAMINATION PAPER 2020
U-LIKE SERIES|Exercise SECTION D|12 Videos
Similar Questions
Explore conceptually related problems
U-LIKE SERIES-ATOMS-SHORT ANSWER QUESTIONS
- Show that the radius of the orbit in hydrogen atom varies as n^(2), wh...
Text Solution
|
- Using relevant Bohr's postulates establish an expression for the speed...
Text Solution
|
- Calculate the value of Bohr's radius. Given that mass of electron = 9....
Text Solution
|
- Calculate the orbital period of the electron in the first excited stat...
Text Solution
|
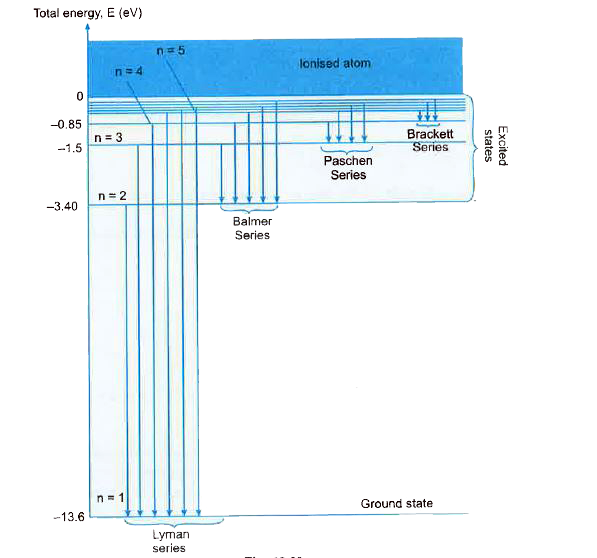
- Sketch the energy level diagram for hydrogen atom and mark the transit...
Text Solution
|
- The energy of the electron in hydrogen atom is known to be expressible...
Text Solution
|
- In the ground state of hydrogen atom , its Bohr radius is given as 5...
Text Solution
|
- Calculate the wavelenght of H(alpha) line in Balmer series of hydr...
Text Solution
|
- Define ionisation energy. How would the ionisation energy whe...
Text Solution
|
- A hydrogen atom in the ground state is excited by an electron beam o...
Text Solution
|
- Calculate the shortest wavelength of the spectral lines emitted in Bal...
Text Solution
|
- State Bohr's quantisaiton condition of angular momentum . Calculate t...
Text Solution
|
- In Bohr's theory of hydrogen atom , calculate the energy of the p...
Text Solution
|
- The short wavelength limit for the Lyman series of the hydrogen spectr...
Text Solution
|
- Calculate the de-Broglie wavelength of the electron orbiting in the n=...
Text Solution
|
- Find out the wavelength of the electron orbiting in the ground ...
Text Solution
|
- (a) In hydrogen atom an electron undergoes transitions from 2nd exc...
Text Solution
|
- Calculate the ratio of the frequencies of the radiation emitted due to...
Text Solution
|
- A photon emitted during the de-excitation of electron from a state to ...
Text Solution
|
- Using de-Broglie's hypothesis, explain Bohr's second postulate of quan...
Text Solution
|