A
B
C
D
Text Solution
AI Generated Solution
The correct Answer is:


Topper's Solved these Questions
Similar Questions
Explore conceptually related problems
MCGROW HILL PUBLICATION-GRAVITATION -HIGHER ORDER THINKING QUESTIONS
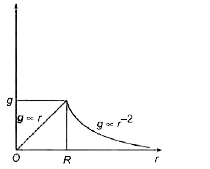
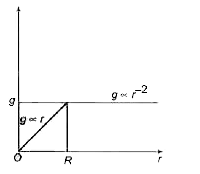
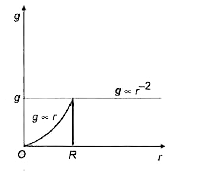
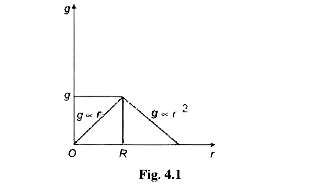
- The variation of g with height or depth (r ) is shown correctly by the...
Text Solution
|
- The weight of a person on earth is 900 N. His weight on the moon will ...
Text Solution
|
- If G is universal gravitational constant and g is acceleration due to ...
Text Solution
|
- Gravity meter is used to measure
Text Solution
|
- Two speres of radii r and 2r touching each other the force of attra...
Text Solution
|
- The tidel waves in the sea are primarily due to gravitational effect ...
Text Solution
|
- If the distance between the sun and the earth is increased by three ti...
Text Solution
|
- The ratio between masses of two planets is 2:3 and ratio between their...
Text Solution
|
- If the earth suddenly shrinks (without changing mass) to half of its p...
Text Solution
|
- F(g) and F(e) represent gravitational and electrostatic force respecti...
Text Solution
|
- Two planets have same density but different radii The acceleration du...
Text Solution
|
- Gravitation on moon is (1)/(6) th of that on earth. When a balloon fil...
Text Solution
|
- The accelearation due to gravity on a planet is 1.96 ms^(-2) if tit ...
Text Solution
|
- Which of the following cannot be used for measuring time in a spacesh...
Text Solution
|
- If both the mass and radius of the earth, each decreases by 50%, the a...
Text Solution
|
- The line joining the places on earht having same values of g are calle...
Text Solution
|
- If different planets have the same density but diferent radii then the...
Text Solution
|
- Rate of change of weight near the earth 's surface varies with height ...
Text Solution
|
- The period of geostationary satellite is
Text Solution
|
- Where will it be profitable to purchase 1 kilogram sugar
Text Solution
|
- As we go from the equator to the poles, the value of g
Text Solution
|