A
B
C
D
Text Solution
Verified by Experts
The correct Answer is:


Topper's Solved these Questions
STATES OF MATTER
AAKASH SERIES|Exercise PRACTICE SHEET (EXERCISE -III) (LEVEL -II ADVANCED)(MORE THAN ONE CORRECT ANSWER TYPE QUESTIONS)|8 VideosSTATES OF MATTER
AAKASH SERIES|Exercise PRACTICE SHEET (EXERCISE -III) (LEVEL -II ADVANCED)(LINKED COMPREHENSION TYPE QUESTIONS)|3 VideosSTATES OF MATTER
AAKASH SERIES|Exercise PRACTICE SHEET (EXERCISE -III) (LEVEL -I MAIN)(STRAIGHT OBJECTIVE TYPE QUESTIONS)|17 VideosSATURATED HYDROCARBONS
AAKASH SERIES|Exercise QUESTIONS FOR DESCRIPTIVE ANSWERS|10 VideosSTOICHIOMETRY
AAKASH SERIES|Exercise QUESTIONS FOR DESCRIPTIVE ANSWERS|59 Videos
Similar Questions
Explore conceptually related problems
AAKASH SERIES-STATES OF MATTER-PRACTICE SHEET (EXERCISE -III) (LEVEL -II ADVANCED)(STRAIGHT OBJECTIVE TYPE QUESTIONS)
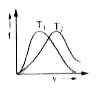
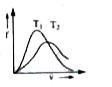
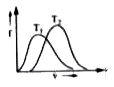
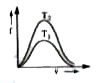
- Which of the following diagaram correctly represents the Boltzmann dis...
Text Solution
|
- The rms speed of N2 molecules in a gas is u. If the temperature is dou...
Text Solution
|
- At constant volume, for a fixed number of moles of a gas, the pressure...
Text Solution
|
- The mean free path of a gas molecule is the distance
Text Solution
|
- If the mean free path is ' lambda' at one atm pressure then its value ...
Text Solution
|
- In which one of the following cases mean free path increases
Text Solution
|
- The number of collisions depends on A) mean free path B) press...
Text Solution
|
- At 127^@C, for helium if time of flight is 0.1 nanosec, the mean free ...
Text Solution
|