Home
Class 11
CHEMISTRY
Which of the following curves represent(...

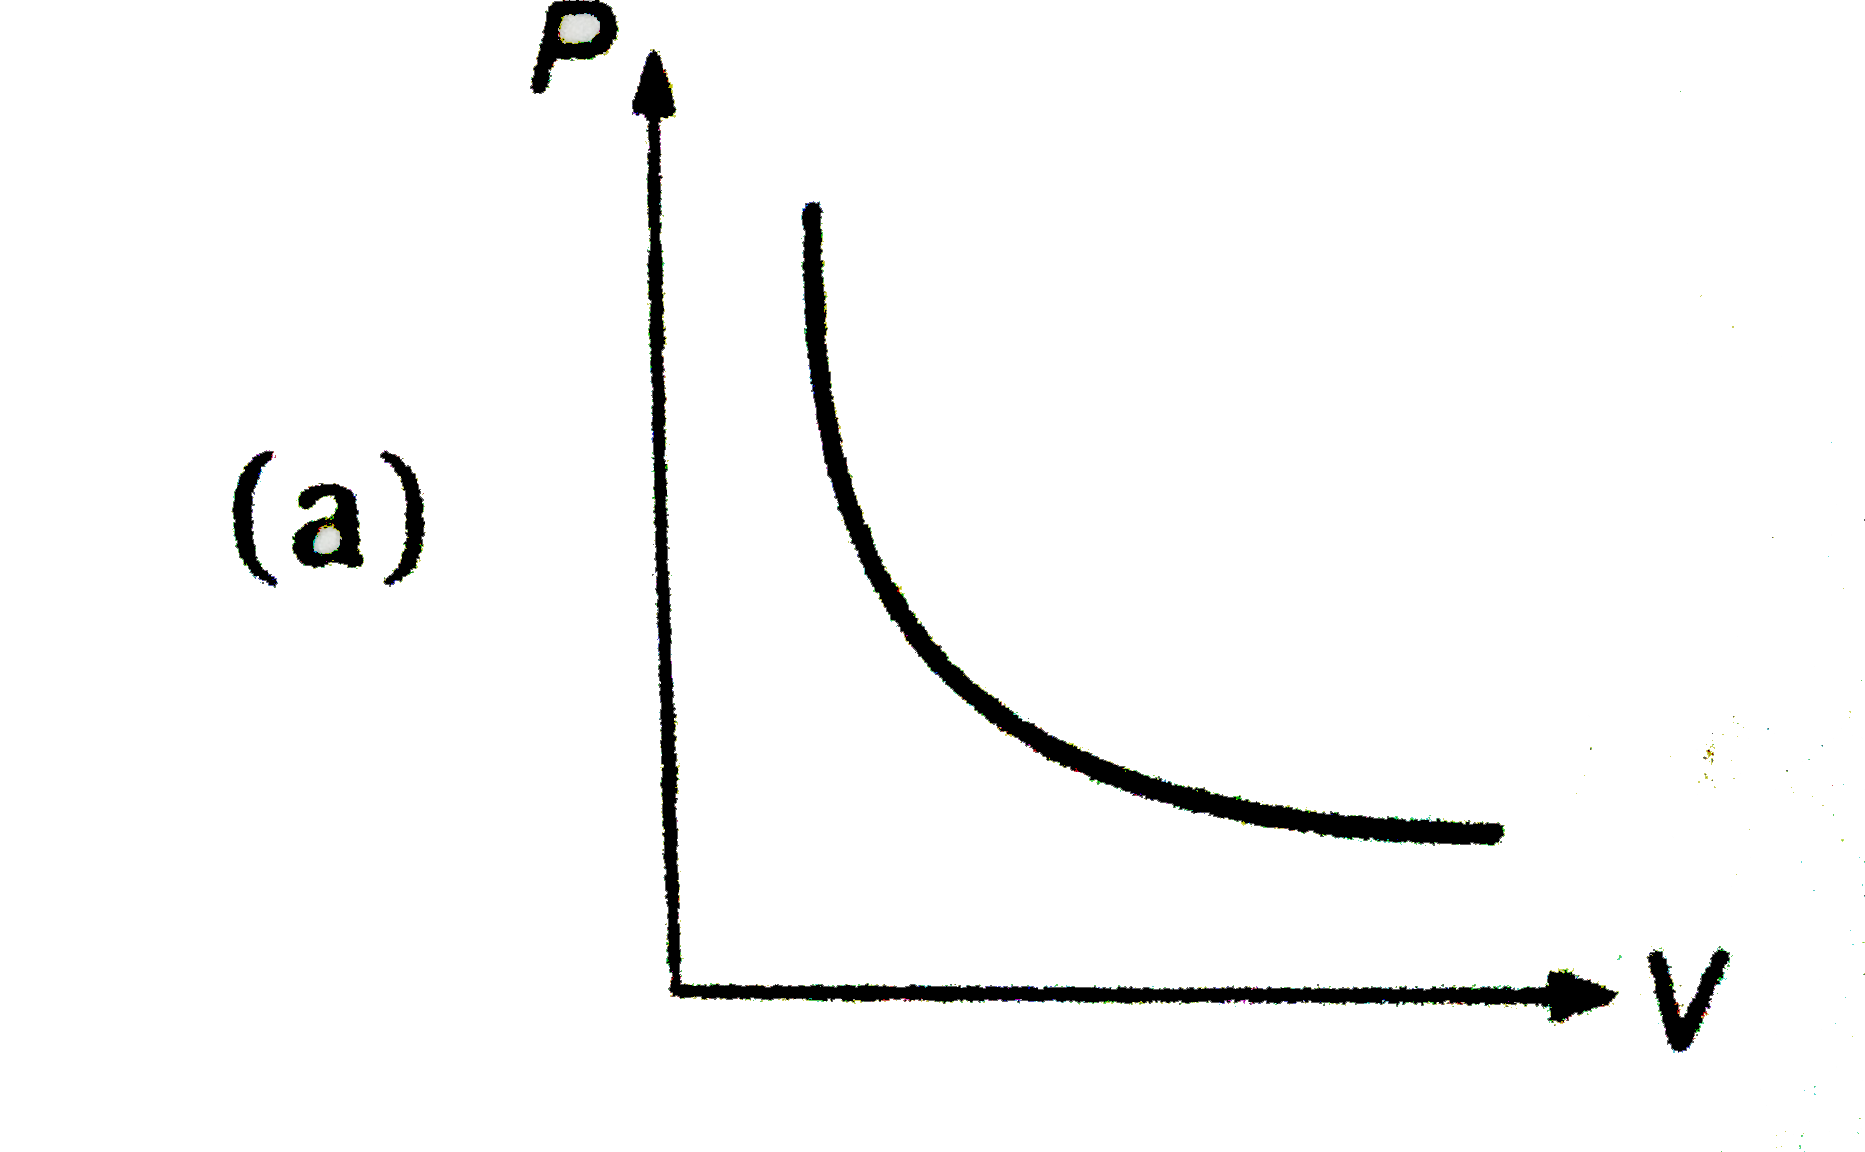
Which of the following curves represent(s) Boyle's law?

A

B

C

D

Text Solution

AI Generated Solution

The correct Answer is:
To determine which curves represent Boyle's law, we need to understand the relationship between pressure (P) and volume (V) of a gas at constant temperature. Boyle's law states that the pressure of a given mass of gas is inversely proportional to its volume when the temperature is held constant. This can be mathematically expressed as: \[ P \propto \frac{1}{V} \] or \[ PV = k \] where \( k \) is a constant. ### Step-by-Step Solution: 1. **Understanding Boyle's Law**: - Boyle's law states that at constant temperature, the product of pressure and volume for a fixed amount of gas is constant. This means that if the volume increases, the pressure decreases, and vice versa. 2. **Graphical Representation**: - The relationship between pressure and volume can be graphically represented. Since pressure is inversely proportional to volume, the graph of P vs. V will be a rectangular hyperbola. This means that as you plot pressure (P) on the y-axis and volume (V) on the x-axis, the curve will approach both axes but never touch them. 3. **Identifying the Curves**: - **Curve A**: If this curve is a rectangular hyperbola, then it represents Boyle's law. - **Curve B**: If this curve represents the relationship of \( \frac{1}{P} \) versus V, it will be a straight line through the origin, indicating that \( \frac{1}{P} \) is directly proportional to V. This is also consistent with Boyle's law. - **Curve C**: If this curve represents a constant product \( PV = k \), it will also reflect Boyle's law. - **Curve D**: If this curve represents pressure versus \( \frac{1}{V} \), it will again be a straight line indicating that pressure is directly proportional to \( \frac{1}{V} \), which is consistent with Boyle's law. 4. **Conclusion**: - All the curves (A, B, C, and D) represent Boyle's law in different forms. Thus, the answer is that all options are correct.

To determine which curves represent Boyle's law, we need to understand the relationship between pressure (P) and volume (V) of a gas at constant temperature. Boyle's law states that the pressure of a given mass of gas is inversely proportional to its volume when the temperature is held constant. This can be mathematically expressed as: \[ P \propto \frac{1}{V} \] or \[ PV = k \] ...
Doubtnut Promotions Banner Mobile Dark
|

Topper's Solved these Questions

  • GASEOUS STATE

    NARENDRA AWASTHI ENGLISH|Exercise Match the Column|7 Videos
  • GASEOUS STATE

    NARENDRA AWASTHI ENGLISH|Exercise Assertion-ReasonType Questions|16 Videos
  • GASEOUS STATE

    NARENDRA AWASTHI ENGLISH|Exercise Level 3 Passage 3|4 Videos
  • ELECTROCHEMISTRY

    NARENDRA AWASTHI ENGLISH|Exercise Subjective problems|14 Videos
  • IONIC EEQUILIBRIUM

    NARENDRA AWASTHI ENGLISH|Exercise Subjective problems|1 Videos

Similar Questions

Explore conceptually related problems

Which of the following graph represents Boyle's law ?

Graphs between pressure and volume are plotted at different temperatures . Which of the following isotherms represents Boyle's law as PV = constant ? (T_(1) gt T_(2) gt T_(3))

Knowledge Check

  • A hot liquid is kept in a bog room. Accoding to Newton's law of cooling rate of cooling liquid (represented as y) is plotted against its temperature T . Which of the following curves may represent the plot?

    A
    B
    C
    D
  • Which of the following curves represent electrostatic field lines correctly?

    A
    B
    C
    D
  • Similar Questions

    Explore conceptually related problems

    Which of the following curves represents the Henry's law ?

    A hot liquid is kept in a big room. According to Newton's law of cooling rate of cooling liquid (represented as y) is plotted against its temperature T . Which of the following curves may represent the plot?

    Which of the following curve represents Verhulst Pearl Logistic growth in a populations ?

    The given curve represents the variation of temperatue as a function of volume for one mole of an ideal gas. Which of the following curves best represents the variation of pressure as a function of volume ? .

    The given curve represents the variation of temperatue as a function of volume for one mole of an ideal gas. Which of the following curves best represents the variation of pressure as a function of volume ? .

    The given curve represents the variation of temperature as a function of volume for one mole of an ideal gas. Which of the following curves best represents the variation of pressure as a function of volume?