Text Solution
Verified by Experts


Topper's Solved these Questions
WORK, ENERGY AND POWER
KUMAR PRAKASHAN|Exercise SECTION - D NCERT Exemplar Solutions (Long Answer Type Questions)|5 VideosWORK, ENERGY AND POWER
KUMAR PRAKASHAN|Exercise SECTION - E Multiple Choice Questions (MCQs)|64 VideosWORK, ENERGY AND POWER
KUMAR PRAKASHAN|Exercise SECTION - D NCERT Exemplar Solutions (Very Short Answer Type Questions)|12 VideosWAVES
KUMAR PRAKASHAN|Exercise SECTION-F (Questions From Module) (Sample questions for preparation of competitive exams)|23 Videos
Similar Questions
Explore conceptually related problems
KUMAR PRAKASHAN-WORK, ENERGY AND POWER -SECTION - D NCERT Exemplar Solutions (Short Answer Type Questions)
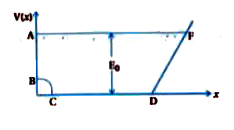
- A graph of potential energy V(x) verses x is shown in figure .A partic...
Text Solution
|
- A ball of mass m , moving with a speed 2v(0) collides inelastically ( ...
Text Solution
|
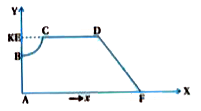
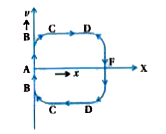
- Consider a one -dimensional motion of a particle with total energy E. ...
Text Solution
|
- The bob A of a pendulum released from 30^(@) to the vertical hits anot...
Text Solution
|
- A raindrop of mass 1.00 g falling from a height of 1m hits the ground ...
Text Solution
|
- Two pendulums with identical bobs and lengths are suspended from a com...
Text Solution
|
- Suppose the average mass of raindrops is 3.0 xx 10^(-5) kg and their a...
Text Solution
|
- An engine is attached to a wagon through a shock absorber of length 1....
Text Solution
|
- An adult weighting 600 N raises the centre of gravity of his body by 0...
Text Solution
|
- On complete combustion a litre of petrol gives off heat equivalent to ...
Text Solution
|