A
B
C
D
Text Solution
Verified by Experts
The correct Answer is:


Topper's Solved these Questions
REPRODUCTIVE HEALTH
NCERT FINGERTIPS ENGLISH|Exercise EXEMPLAR|13 VideosREPRODUCTIVE HEALTH
NCERT FINGERTIPS ENGLISH|Exercise ASSERTION-REASON|15 VideosREPRODUCTIVE HEALTH
NCERT FINGERTIPS ENGLISH|Exercise Reproductive Health|133 VideosREPRODUCTION IN ORGANISM
NCERT FINGERTIPS ENGLISH|Exercise All Questions|137 VideosSEXUAL REPRODUCTION IN FLOWERING PLANTS
NCERT FINGERTIPS ENGLISH|Exercise Sexual Reproduction In Flowering Plants|145 Videos
Similar Questions
Explore conceptually related problems
NCERT FINGERTIPS ENGLISH-REPRODUCTIVE HEALTH-HOTS
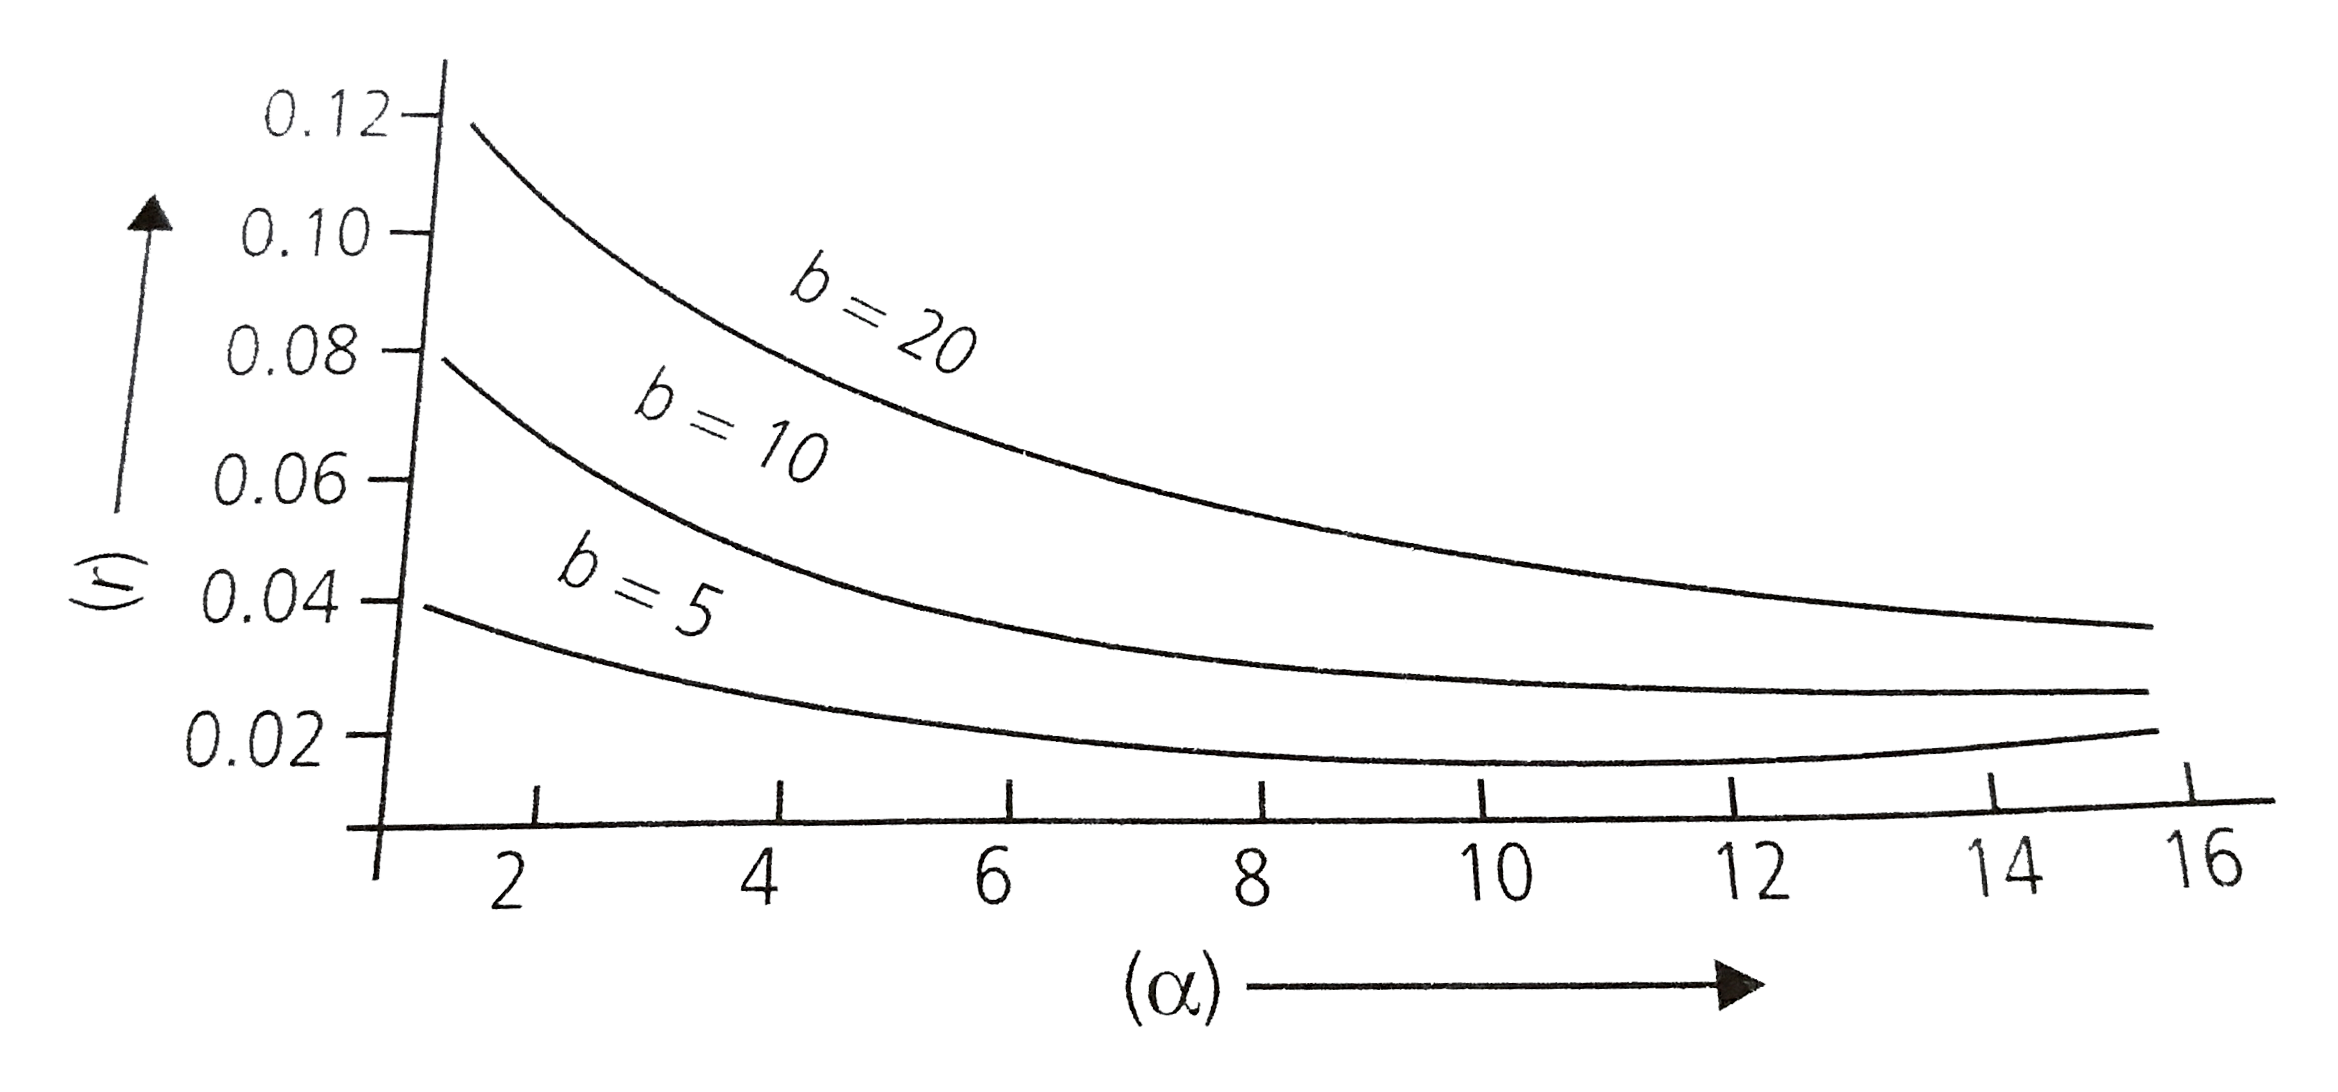
- The graph below shows the relationships of per capita population growt...
Text Solution
|
- The diagram below represents the development of a human zygote fertili...
Text Solution
|
- Artificial insemination means
Text Solution
|
- Which one of the following statements is correct regarding sexually tr...
Text Solution
|
- The given figure represents locatons in human female reproductive syst...
Text Solution
|