A
B
C
D
Text Solution
AI Generated Solution
The correct Answer is:


Topper's Solved these Questions
Similar Questions
Explore conceptually related problems
NCERT FINGERTIPS ENGLISH-WAVES-Assertion And Reason
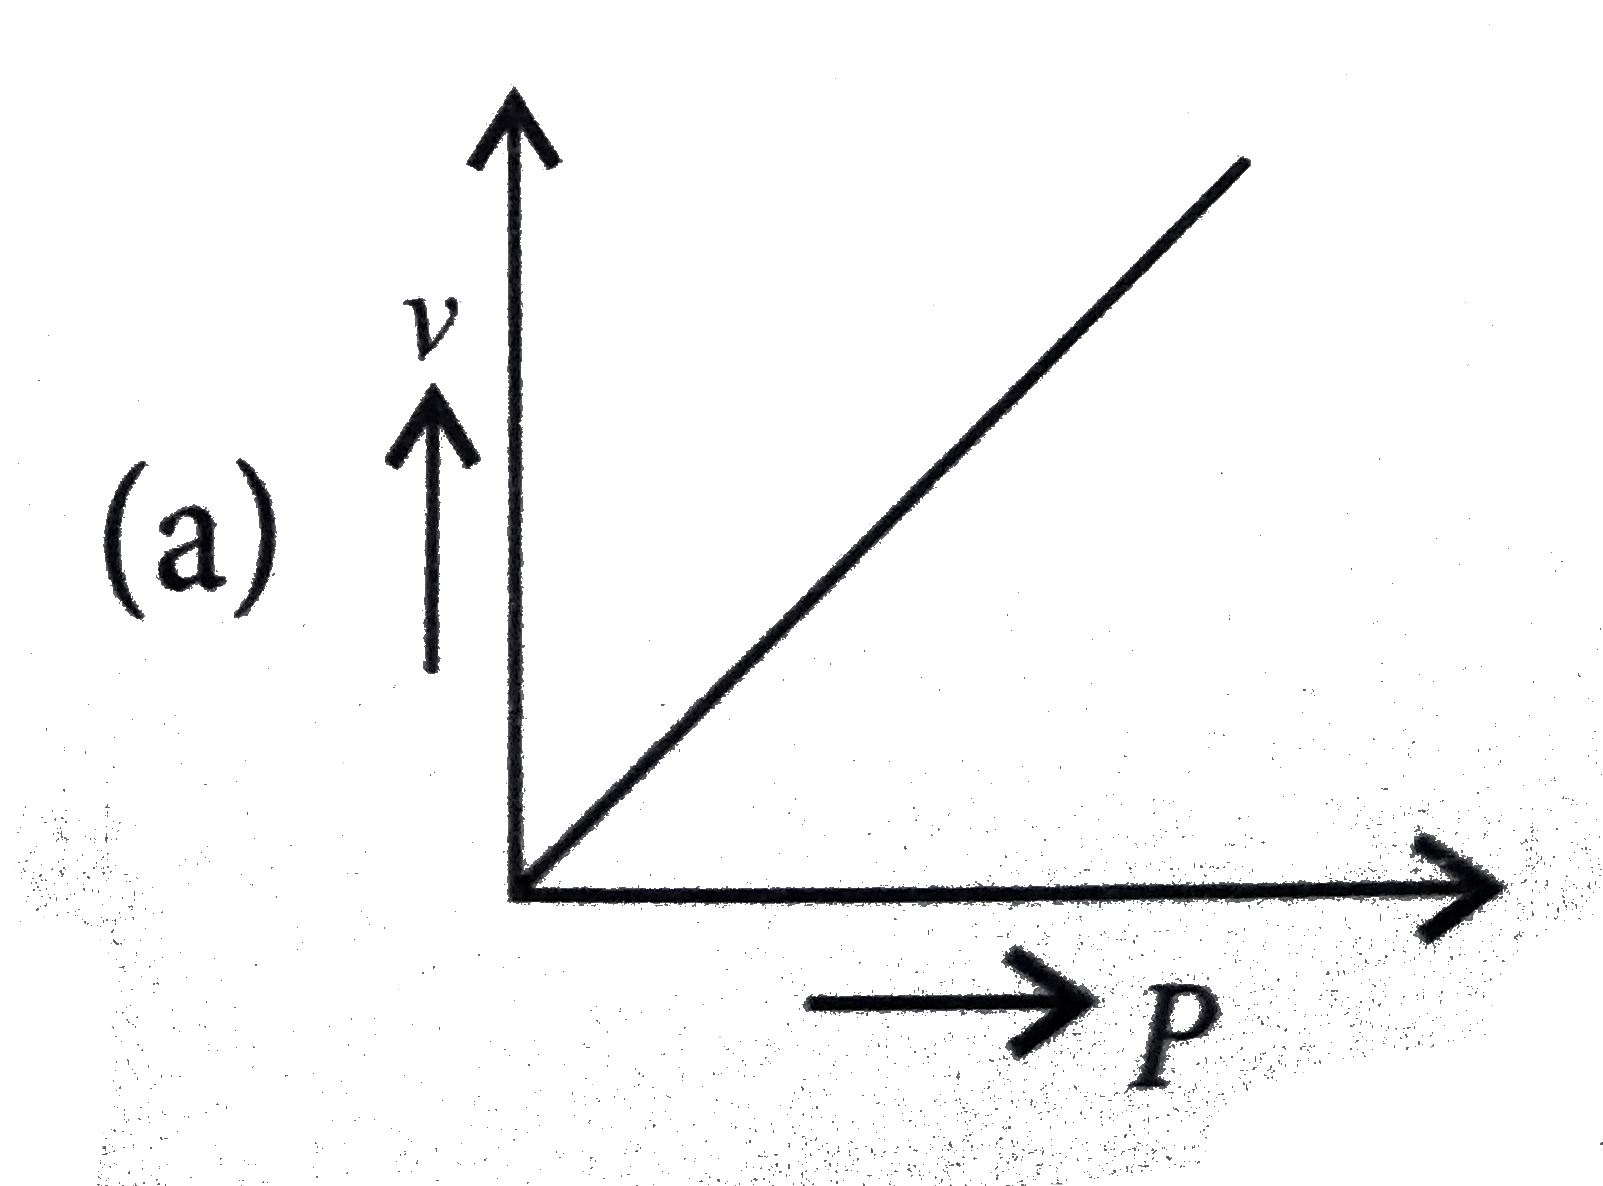
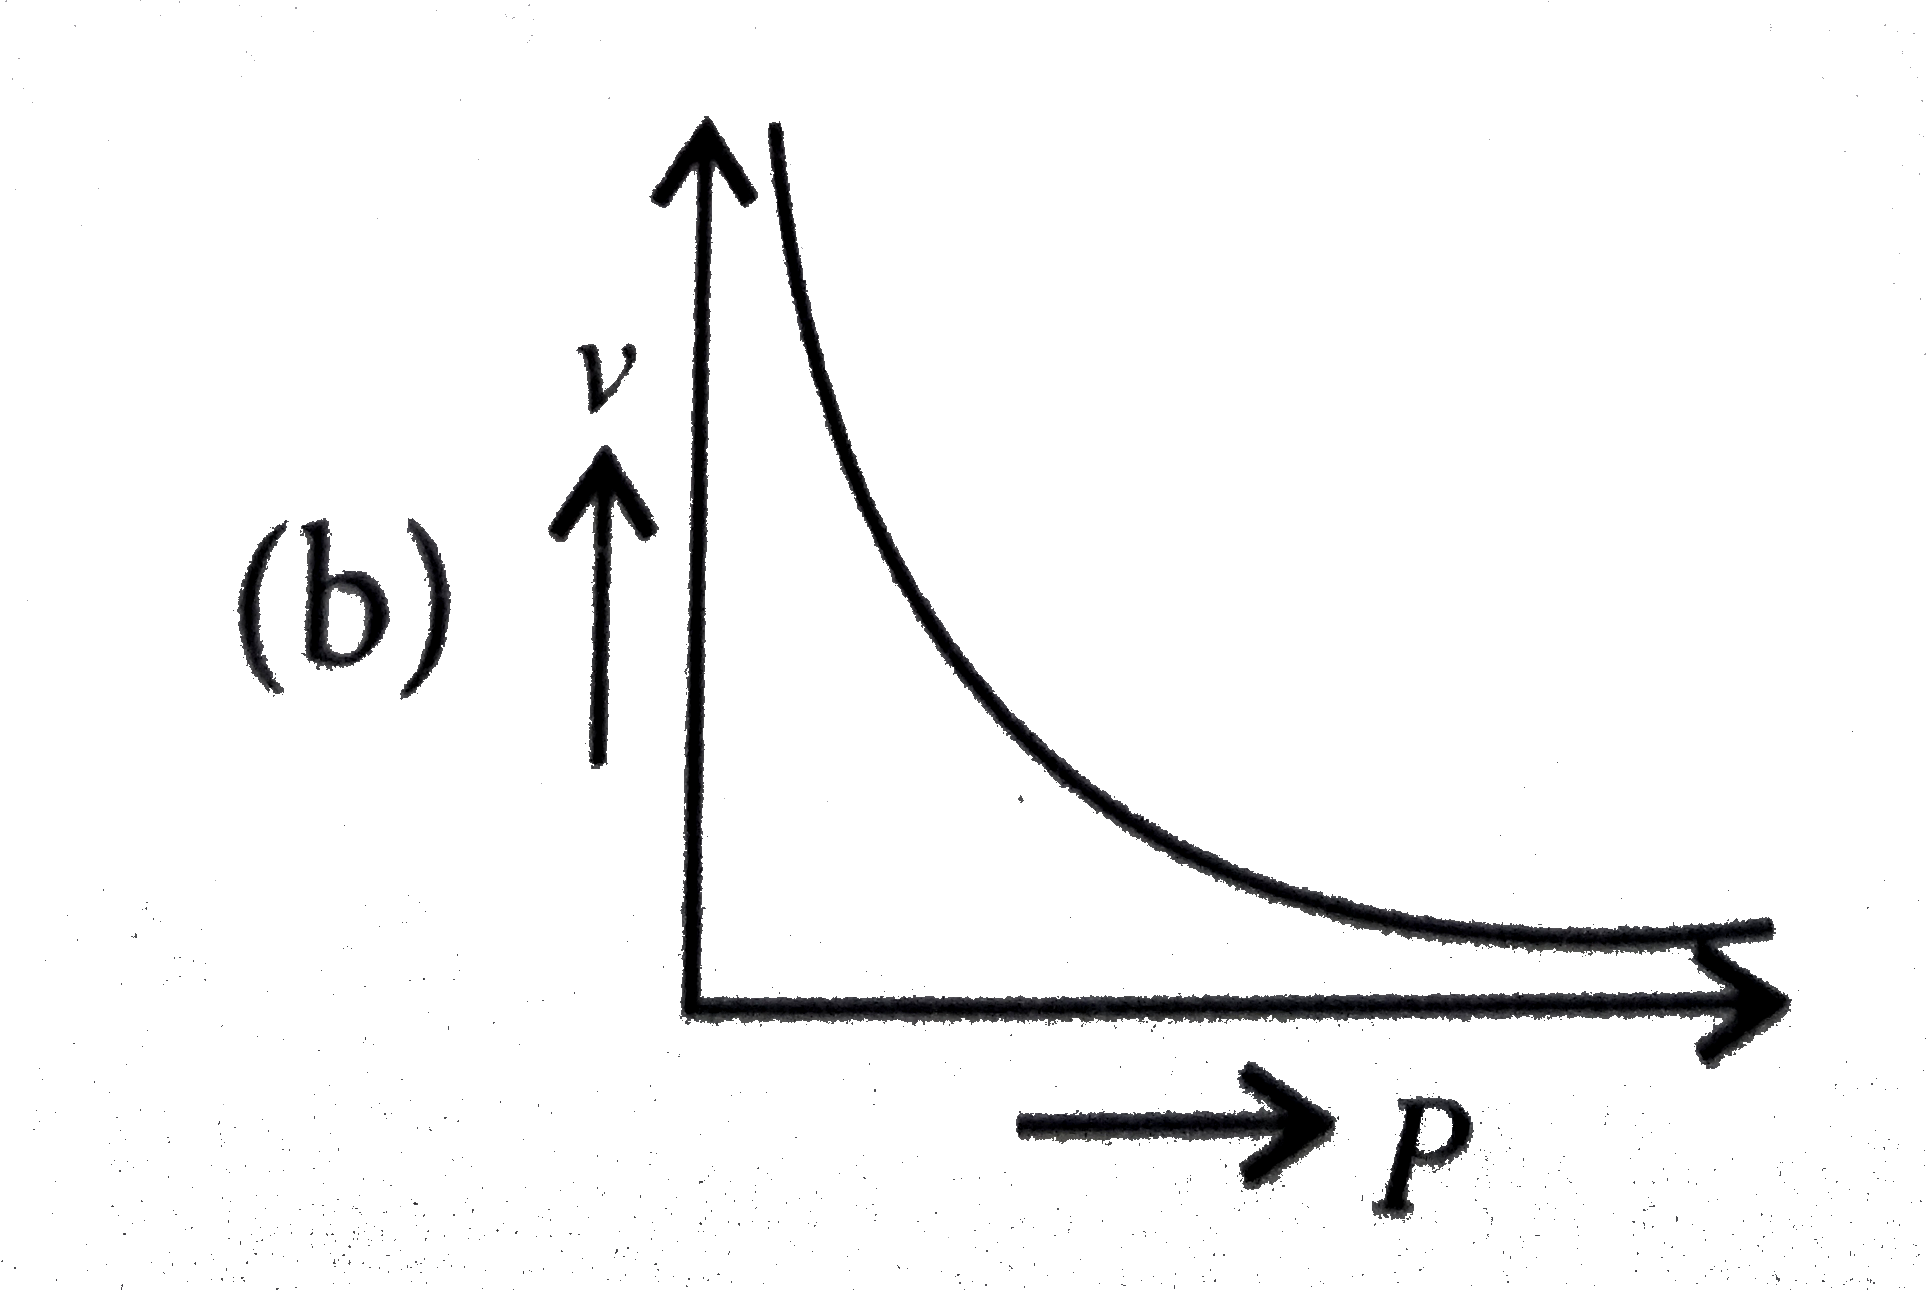
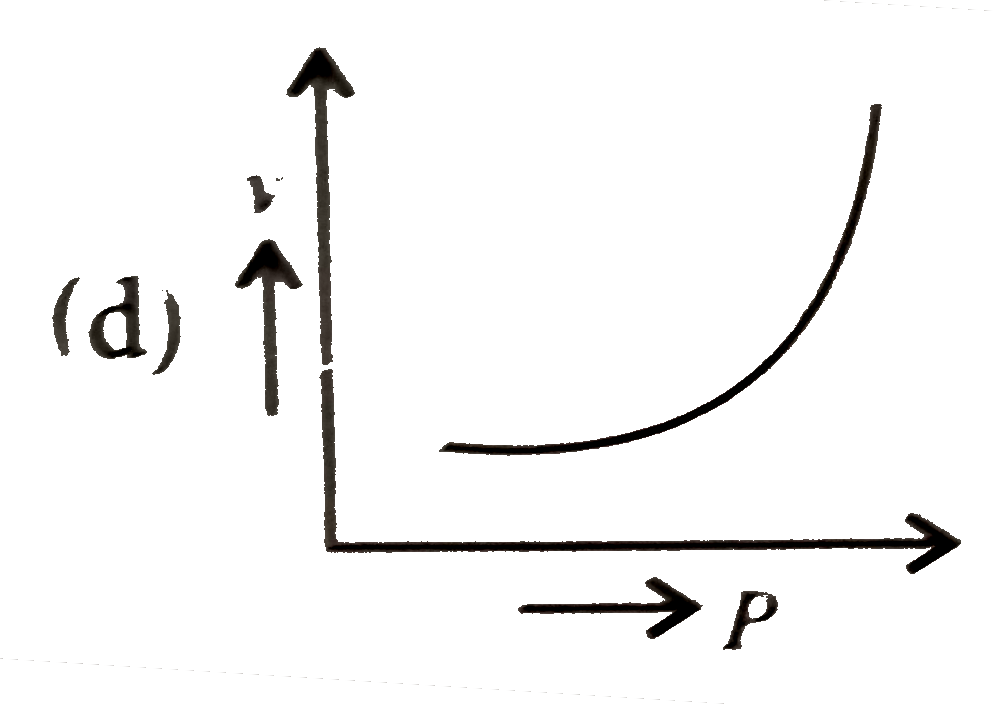
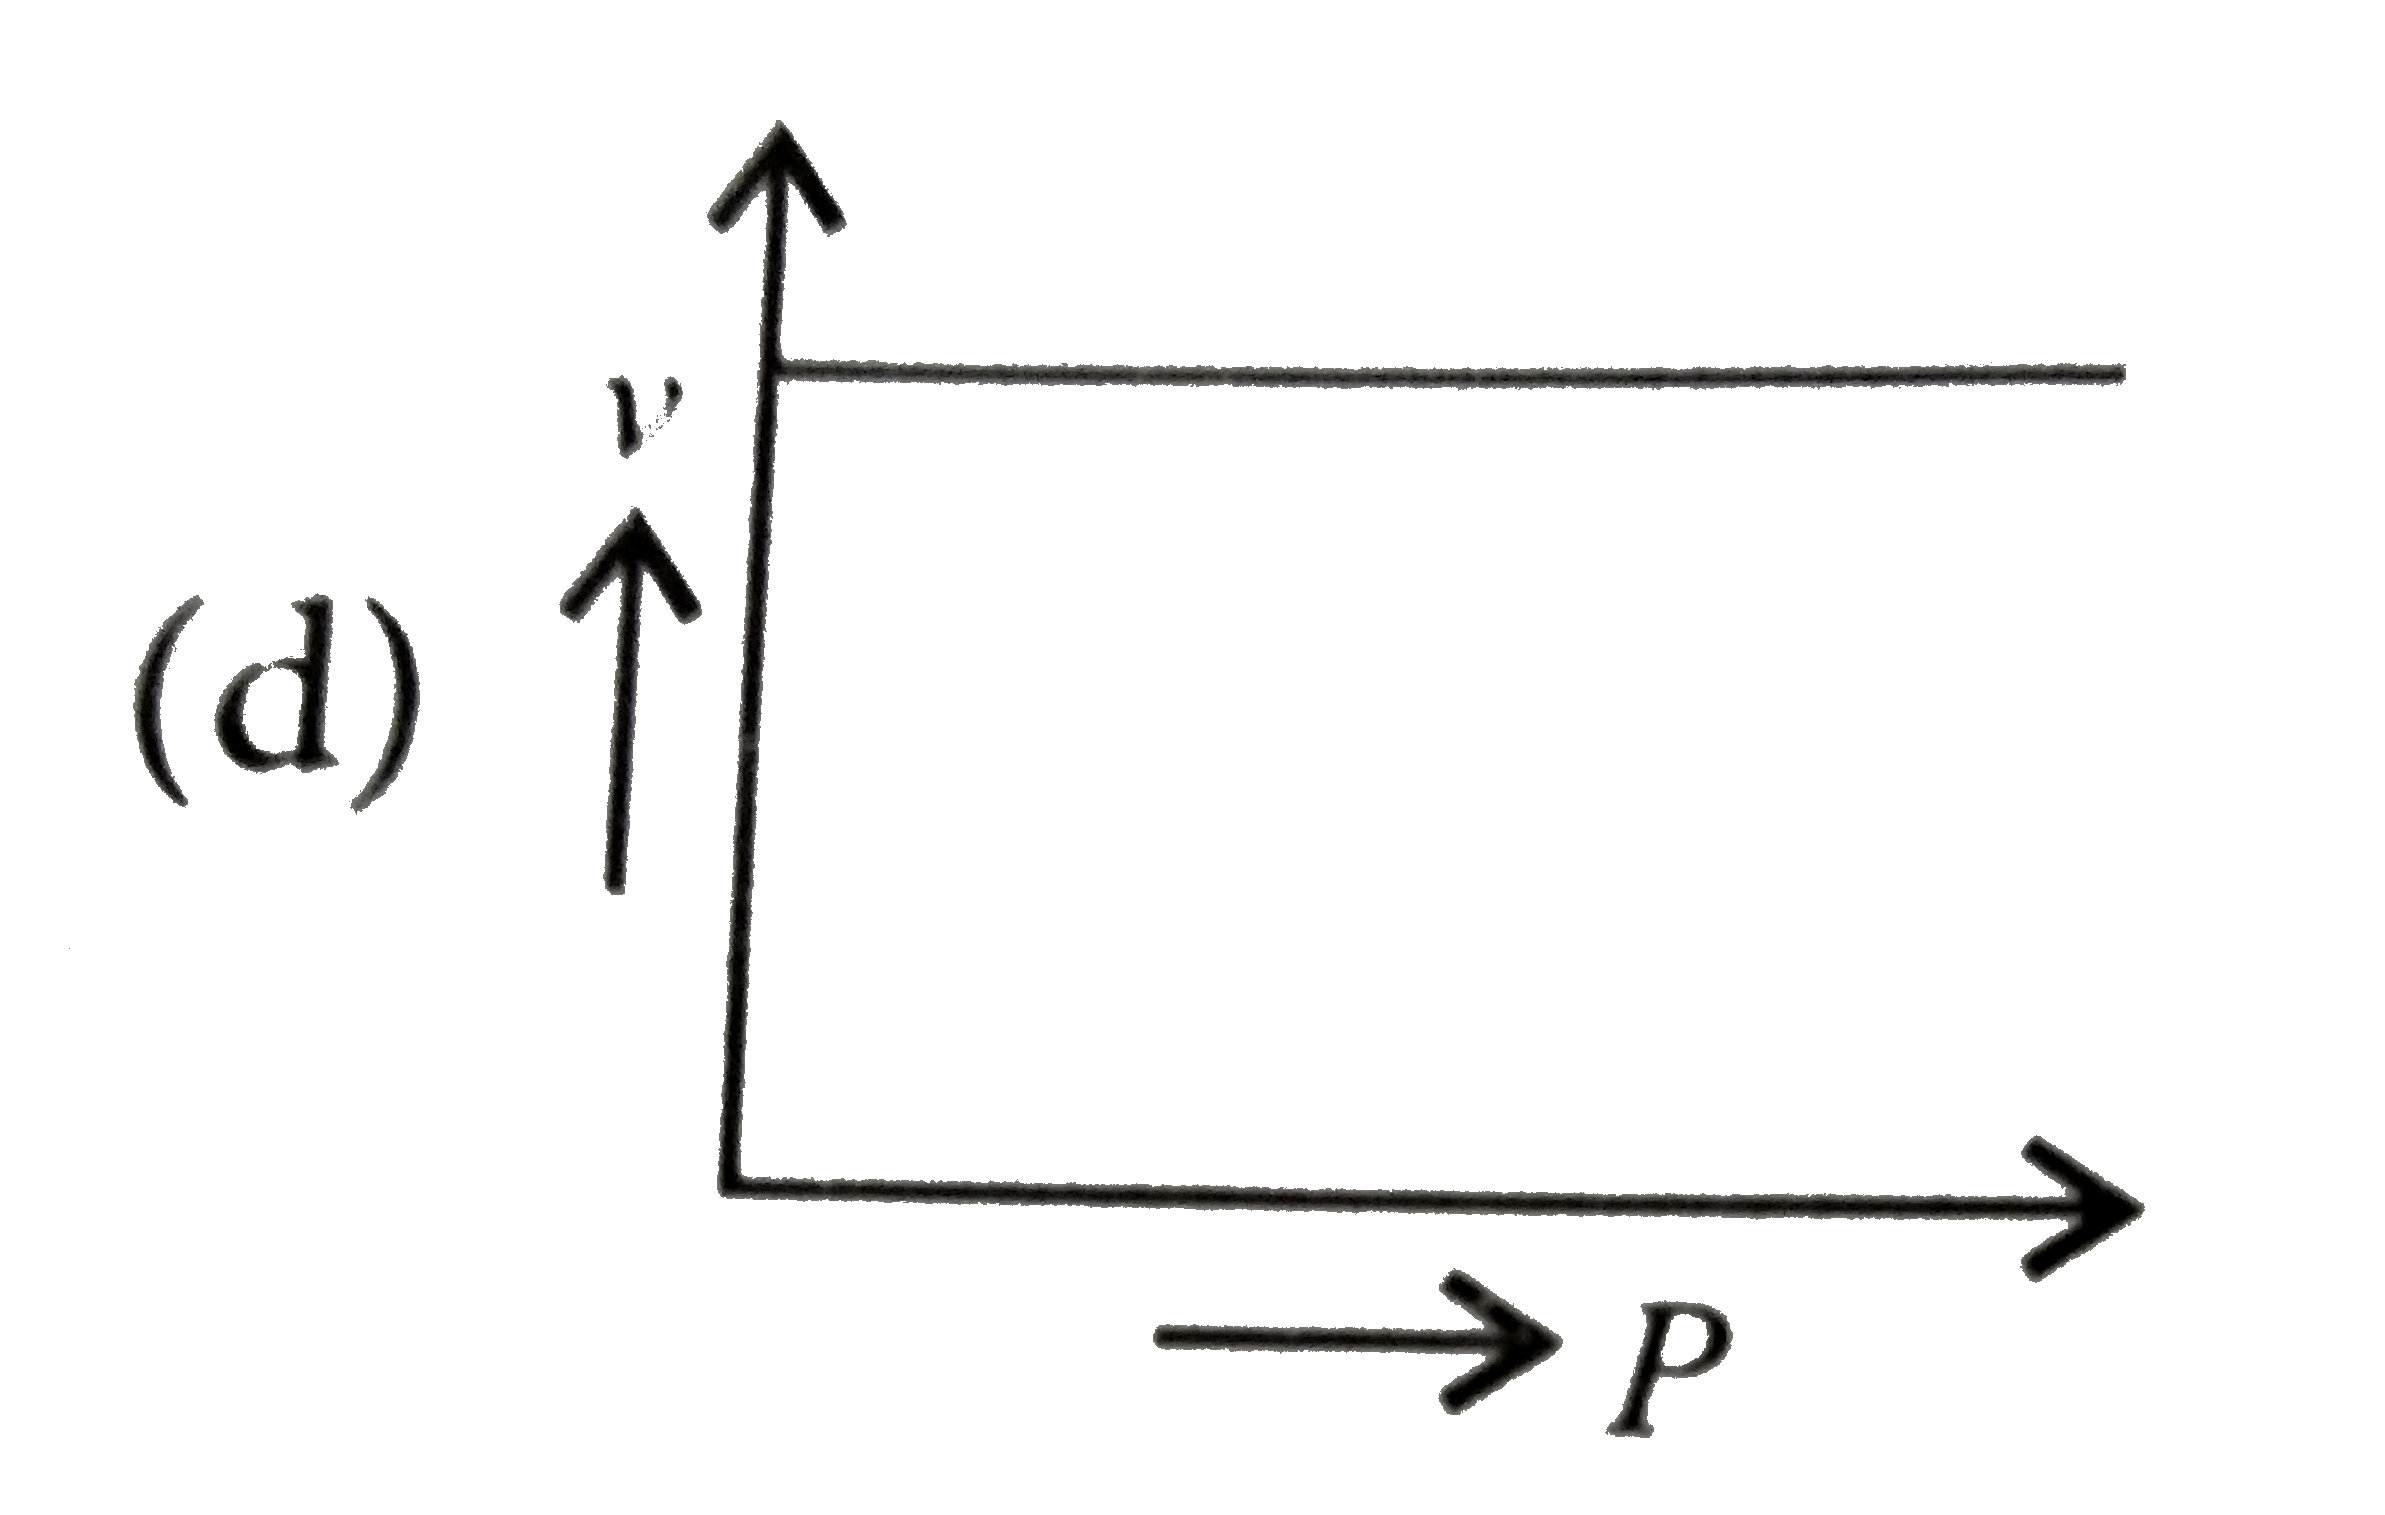
- A student plotted the following four graphs representing the variation...
Text Solution
|
- Assertion : A wave is motion of matter as a whole in a medium. Reaso...
Text Solution
|
- With the propagation of a longitudinal wave through a material medium,...
Text Solution
|
- S(1): Source and observer both are stationary and wind is blowing in a...
Text Solution
|
- Assertion: The change in air pressure effects the speed of sound. Re...
Text Solution
|
- Assertion : The speed of soun in solids is maximum though density is l...
Text Solution
|
- Assertion : Speed of mechanical wave in the medium depends on the velo...
Text Solution
|
- Assertion : The basic of Laplace correction was that, exchange of heat...
Text Solution
|
- Two waves of same frequency and intensity superimpose on each other in...
Text Solution
|
- Statement-1: On reflection from a rigid boudnary (denser medium ), the...
Text Solution
|
- In standing waves, select incorrect
Text Solution
|
- Assertion : The interference of two identical waves moving in same dir...
Text Solution
|
- Assertion: The fundamental frequency of an open organ pipe increases a...
Text Solution
|
- Assertion : The sound emitted by the source travels in all directions....
Text Solution
|
- When a source of sound passes us, whether it be a car horn or a train ...
Text Solution
|
- Statement I: Intensity of sound wave changes when the listener moves t...
Text Solution
|