A
B
C
D
Text Solution
Verified by Experts
The correct Answer is:


Topper's Solved these Questions
STATES OF MATTER
NCERT FINGERTIPS ENGLISH|Exercise Kinetic Molecular Theory Of Gases|4 VideosSTATES OF MATTER
NCERT FINGERTIPS ENGLISH|Exercise Behaviour Of Real Gases|15 VideosSTATES OF MATTER
NCERT FINGERTIPS ENGLISH|Exercise Ideal Gas Equation|33 VideosSOME BASIC CONCEPTS OF CHEMISTRY
NCERT FINGERTIPS ENGLISH|Exercise NCERT Exemplar|11 VideosSTRUCTURE OF ATOM
NCERT FINGERTIPS ENGLISH|Exercise Assertion And Reason|15 Videos
Similar Questions
Explore conceptually related problems
NCERT FINGERTIPS ENGLISH-STATES OF MATTER -Kinetic Energy And Molecular Speeds
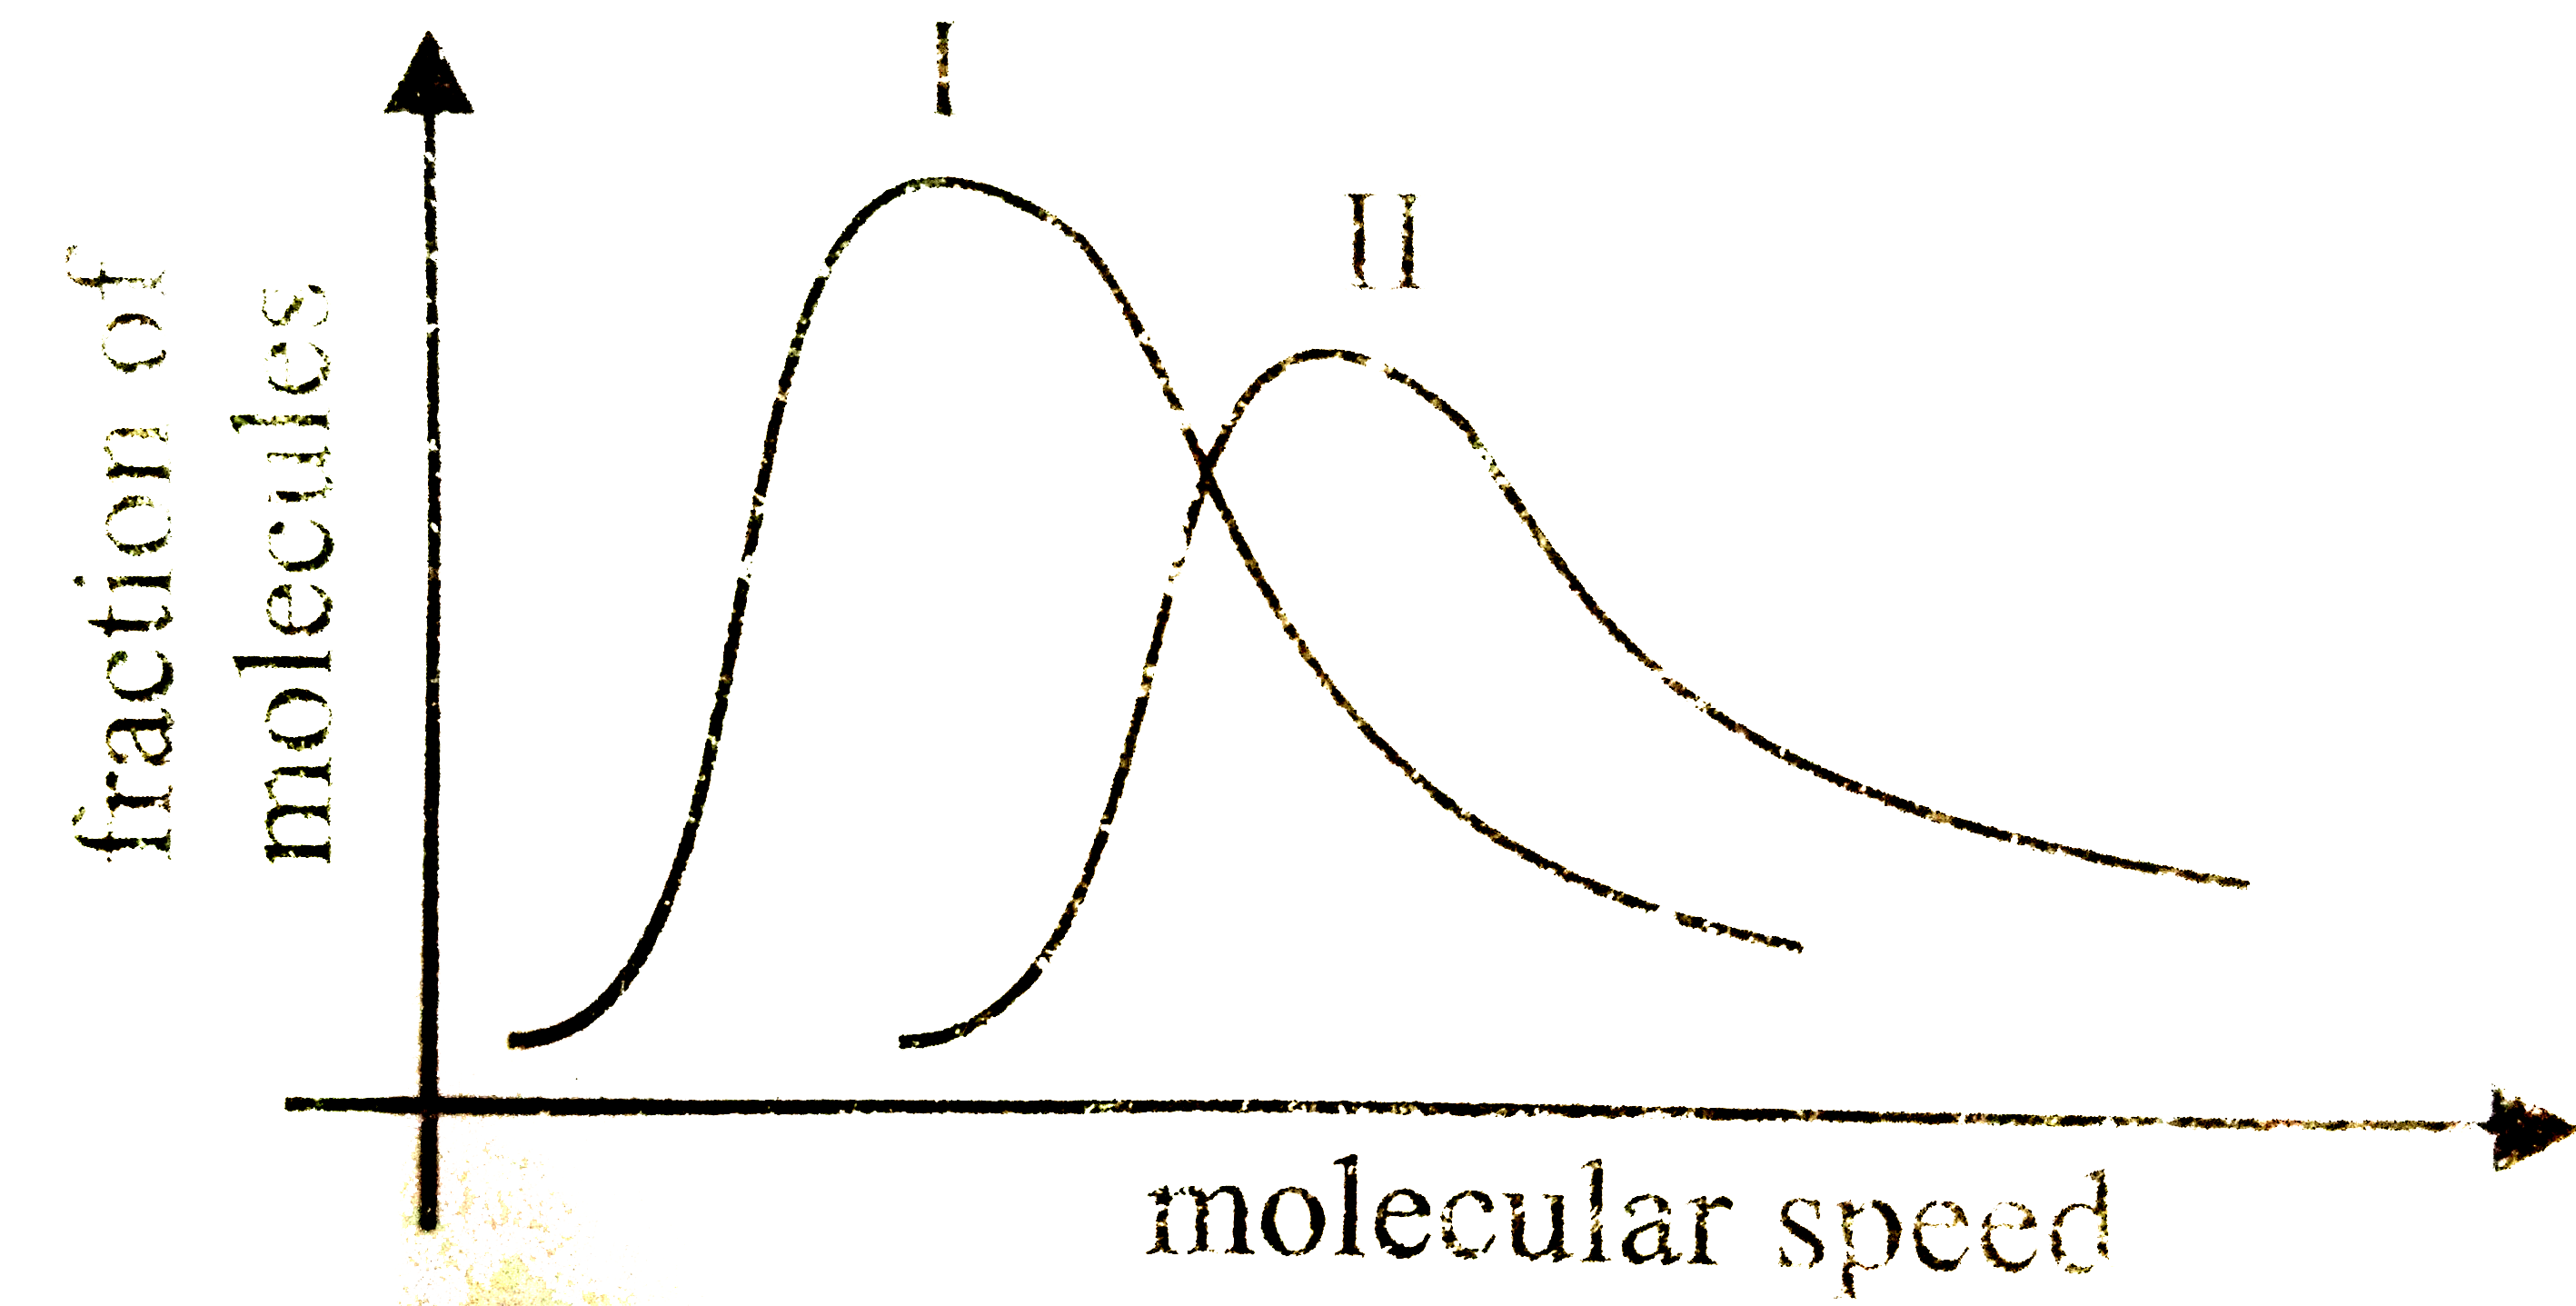
- The graphs representing distribution of molecular speeds at 300 K for ...
Text Solution
|
- Match the columm I with column II and mark the appropriate choice .
Text Solution
|
- At what temperature will the molar kinetic energy of 0.3 mol of 'He' b...
Text Solution
|
- The rms speed of N(2) molecules in a gas in u. If the temperature is d...
Text Solution
|