Home
Class 12
PHYSICS
The velocity-time plot for a particle mo...

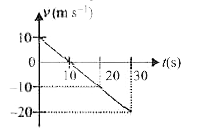
The velocity-time plot for a particle moving on a straight line is shown in figure.

A

The particle has a constant acceleration.

B

The particle has never tumed around.

C

The particle has zero displacement.

D

The average speed in the interval 0 to 10 s is the same as the average speed in the interval 10s to 20 s.

Text Solution

Verified by Experts

The correct Answer is:
A, D

Since the graph is a straight line, its slope is constant. It means acceleration of the particle is constant. Velocity of the particle changes from positive to negative at t= 10 s, so particle changes direction at this time. The particle has zero displacement up to 20 s, but not for the entire motion .
The average speed in the interval of 0 to 10 s is the same as the average speed in the interval of 10 s to 20 s beccause distance covered in both time interval is same.
Doubtnut Promotions Banner Mobile Dark
|

Topper's Solved these Questions

  • KINEMATICS

    MTG-WBJEE|Exercise WB JEE Previous Years Questions (CATEGORY 1 : Single Option Correct Type (1 Mark) )|9 Videos
  • KINEMATICS

    MTG-WBJEE|Exercise WB JEE Previous Years Questions (CATEGORY 3 : One or More than One Option Correct Type (2 Marks) )|1 Videos
  • KINEMATICS

    MTG-WBJEE|Exercise WB JEE WORKOUT ( CATEGORY 2 : Single Option Correct Type (2 Marks))|15 Videos
  • HEAT AND THERMAL PHYSICS

    MTG-WBJEE|Exercise WB JEE PREVIOUS YEARS QUESTIONS|15 Videos
  • KINETIC THEORY OF GASES

    MTG-WBJEE|Exercise WB JEE PREVIOUS YEARS QUESTIONS (MCQ)|7 Videos

Similar Questions

Explore conceptually related problems

The velocity-time plot for a particle moving on a straight line is shown in the figure, then

The velocity-time graph of a particle moving along a straight line is shown in Figure 2.W7.Is the motion uniform?

Knowledge Check

  • The velocity time plot for a particle moving on straight line is shown in the figure.

    A
    The particle has a constant acceleration
    B
    The particle has nevedr turned around
    C
    The paeticle has zero displacement.
    D
    The average speed in the interval 0 to 10 s is the same as the average speed in the interval 10 s to 20s.
  • The velocity- time plot for a particle moving on a straight line is shown in the figure

    A
    the particle has a non uniform acceleration
    B
    the particle has never turned around
    C
    the particle has zero displacement
    D
    the average speed in the interval 0 to 10 s is the same as the average speed in the interval 10 s to 20 s
  • The velocity-time graph of a particle moving in a straight line is shown in figure. The mass of the particle is 2kg . Work done by all the forces acting on the particle in time interval between t=0 to t=10s is

    A
    (a) `300J`
    B
    (b) `-300J`
    C
    (c) `400J`
    D
    (d) `-400J`
  • Similar Questions

    Explore conceptually related problems

    The velocity-time graph of a particle moving along a straight line is shown in Figure 2.W7. Does the particle change its direction of motion ?

    Velocity-time graph of a particle moving in a straight line is shown in figure. In the time interval from t = 0 to t = 14 s, find (a) average velocity and (b) average speed of the particle.

    The velocity-time graph of a particle moving along a straight line is shown in the figure-given below The displacement of the particle in 5 second is

    Velocity-time graph of a particle moving in a straight line is shown in figure. In the time interval from t = 0 to t = 14 s, find: Q. average speed of the particle

    Velocity-time graph of a particle moving in a straight line is shown in figure. In the time interval from t = 0 to t = 14 s, find: Q. average velocity and