Text Solution
Verified by Experts


Topper's Solved these Questions
THERMODYNAMICS
AAKASH SERIES|Exercise EXERCISE - 1A|135 VideosTHERMODYNAMICS
AAKASH SERIES|Exercise EXERCISE - 1B|32 VideosTHERMODYNAMICS
AAKASH SERIES|Exercise QUESTIONS FOR DESCRIPTIVE ANSWERS|7 VideosTHERMAL PROPERTIES OF MATTER
AAKASH SERIES|Exercise ADDITIONAL PRACTICE EXERCISE (LEVEL - II) PRACTICE SHEET (ADVANCED) Integer/Subjective Type Questions|2 VideosTHERMOMETRY
AAKASH SERIES|Exercise Numerical Exercise (LEVEL- 1)|11 Videos
Similar Questions
Explore conceptually related problems
AAKASH SERIES-THERMODYNAMICS-Problem
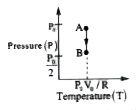
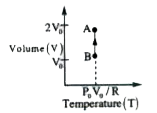
- Draw the P-T and V-T diagrams of an isochoric process of n moles of an...
Text Solution
|
- Draw the P-T and V-T diagrams for an isobaric process of expansion, co...
Text Solution
|
- Draw the P-T and V-T diagrams for an isothermal process, corresponding...
Text Solution
|
- At 27^(@)C , two moles of an ideal mono-atomic gas occupy a volumeV. T...
Text Solution
|
- A piston divides a closed gas cylinder into two parts. Initially the p...
Text Solution
|
- An ideal gas is compressed to half of the volume. How much work is don...
Text Solution
|
- P-V diagram of a diatomic gas is a straight line passing through origi...
Text Solution
|
- Find the molar heat capacity in a process of a diatomic gas if it does...
Text Solution
|
- A monoatomic gas undergoes a process given by 2dU+3dW=0, then what is ...
Text Solution
|
- Ideal monoatomic gas is taken through a process dQ=2dU . What is the m...
Text Solution
|
- The relation between U,P and V for an ideal gas is U=2+3PV . What is t...
Text Solution
|
- One mole of a monoatomic ideal gas undergoes the process A rarr B in t...
Text Solution
|
- Consider a cycle tyre bering filled with air by a pump. Let V be the v...
Text Solution
|
- Consider a P-V diagram in which the path followed by one mole of perfe...
Text Solution
|
- The initial state of a certain gas is (P(i)V(i) T(i)). It undergoes ex...
Text Solution
|
- Consider that an ideal gas (n Moles) is expanding in a process given b...
Text Solution
|
- A cycle followed by an engine (made of one mole of an ideal gas in a c...
Text Solution
|
- Consider one mole of perfect gas in a cylinder of uniform cross sectio...
Text Solution
|
- The temperature-entropy diagram of a reversible engine cycle is given ...
Text Solution
|
- An inventor claims to have developed an engine that during a certain t...
Text Solution
|