Text Solution
Verified by Experts


Similar Questions
Explore conceptually related problems
Recommended Questions
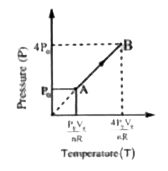
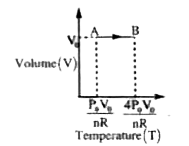
- Draw the P-T and V-T diagrams of an isochoric process of n moles of an...
Text Solution
|
- Draw the P-T and V-T diagrams of an isochoric process of n moles an id...
Text Solution
|
- Draw the P-T and V-T diagrams for an isobabaric process of expansion, ...
Text Solution
|
- One mole of an ideal gas at pressure P(0) and temperature T(0) is expa...
Text Solution
|
- If n moles of an ideal gas are expanded is isothermally and reversibly...
Text Solution
|
- An ideal monatomic gas is at P(0), V(0). It is taken to final volume 2...
Text Solution
|
- An ideal gas (C(p)//C(v) =gamma) having initial pressure P(0) and volu...
Text Solution
|
- One mole of an ideal gas at temperature T was cooled isochorically til...
Text Solution
|
- One mole of an ideal gas at temperature T was cooled isochorically til...
Text Solution
|