Text Solution
Verified by Experts
The correct Answer is:


Topper's Solved these Questions
KINEMATICS
DC PANDEY ENGLISH|Exercise More Than One Correct|6 VideosKINEMATICS
DC PANDEY ENGLISH|Exercise Comprehension|7 VideosKINEMATICS
DC PANDEY ENGLISH|Exercise Objective|45 VideosGRAVITATION
DC PANDEY ENGLISH|Exercise (C) Chapter Exercises|45 VideosKINEMATICS 1
DC PANDEY ENGLISH|Exercise INTEGER_TYPE|15 Videos
Similar Questions
Explore conceptually related problems
DC PANDEY ENGLISH-KINEMATICS-Subjective
- A particle of mass m is released from a certain height h with zero ini...
Text Solution
|
- A ball is dropped from a height of 80 m on a floor. At each collision,...
Text Solution
|
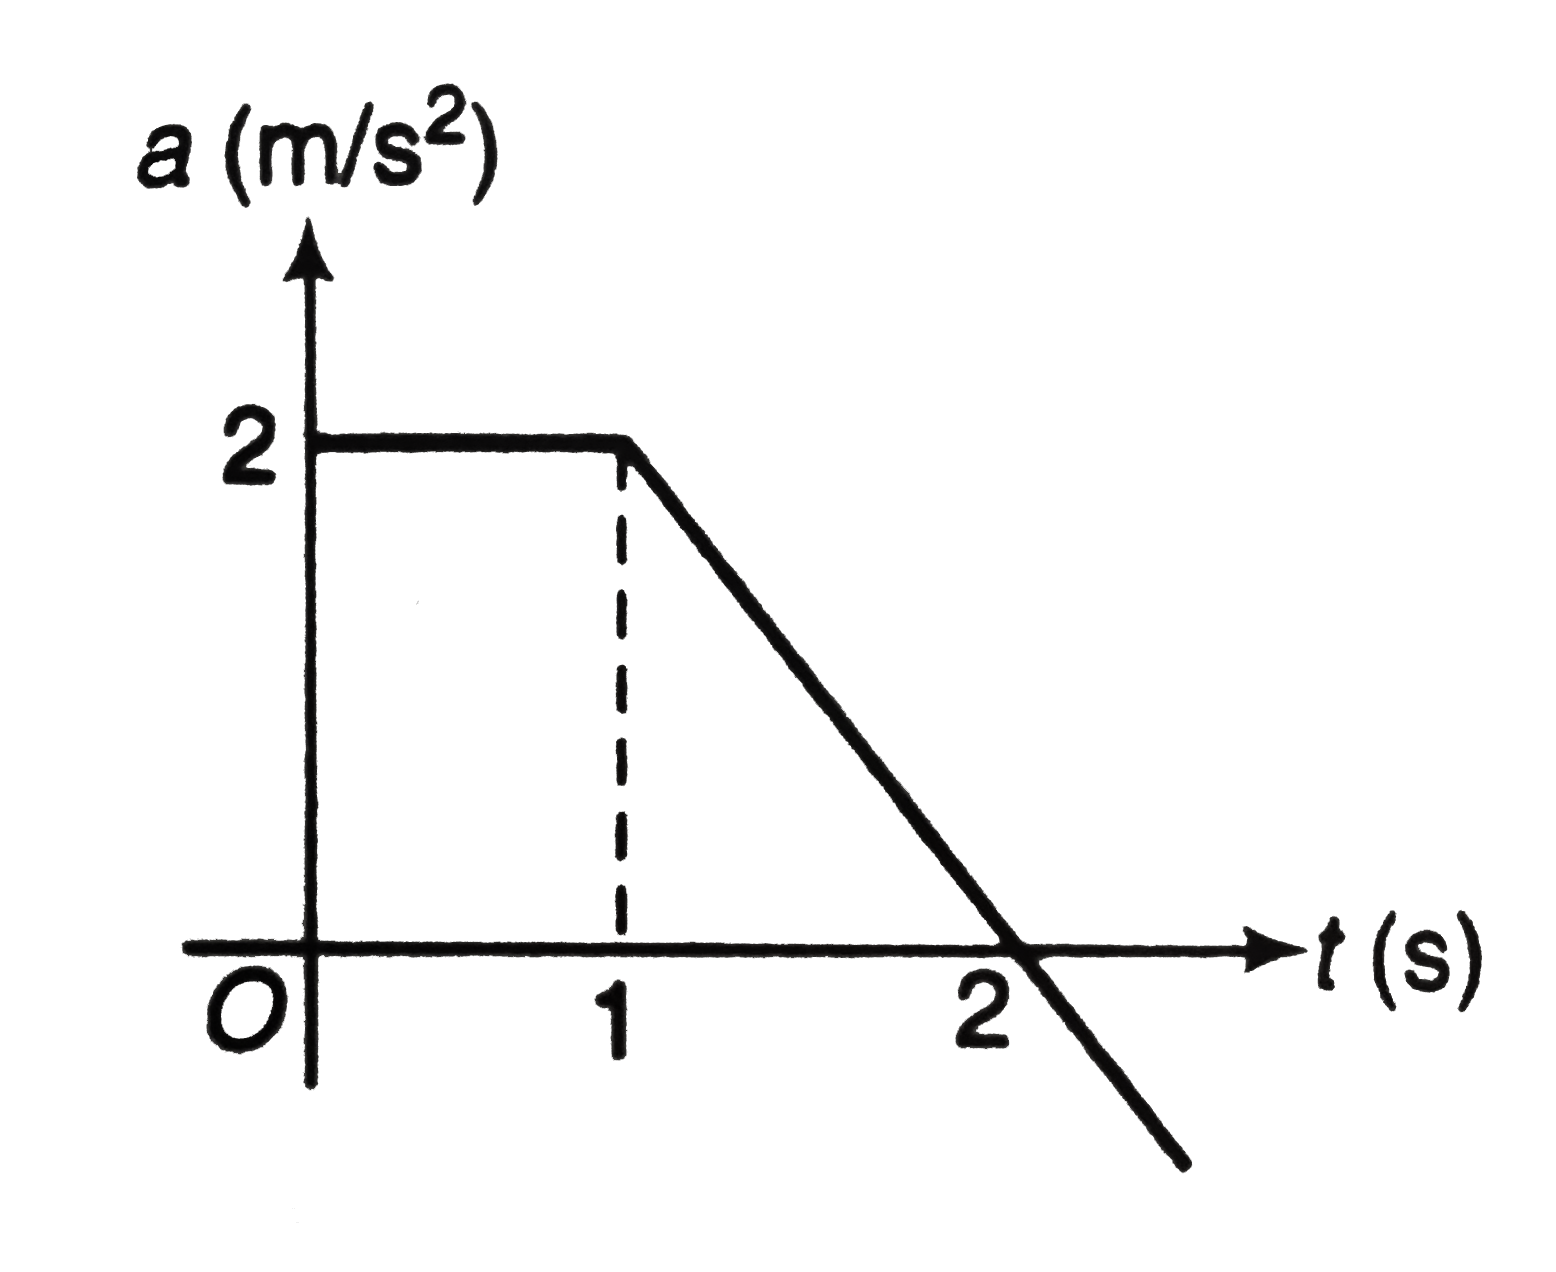
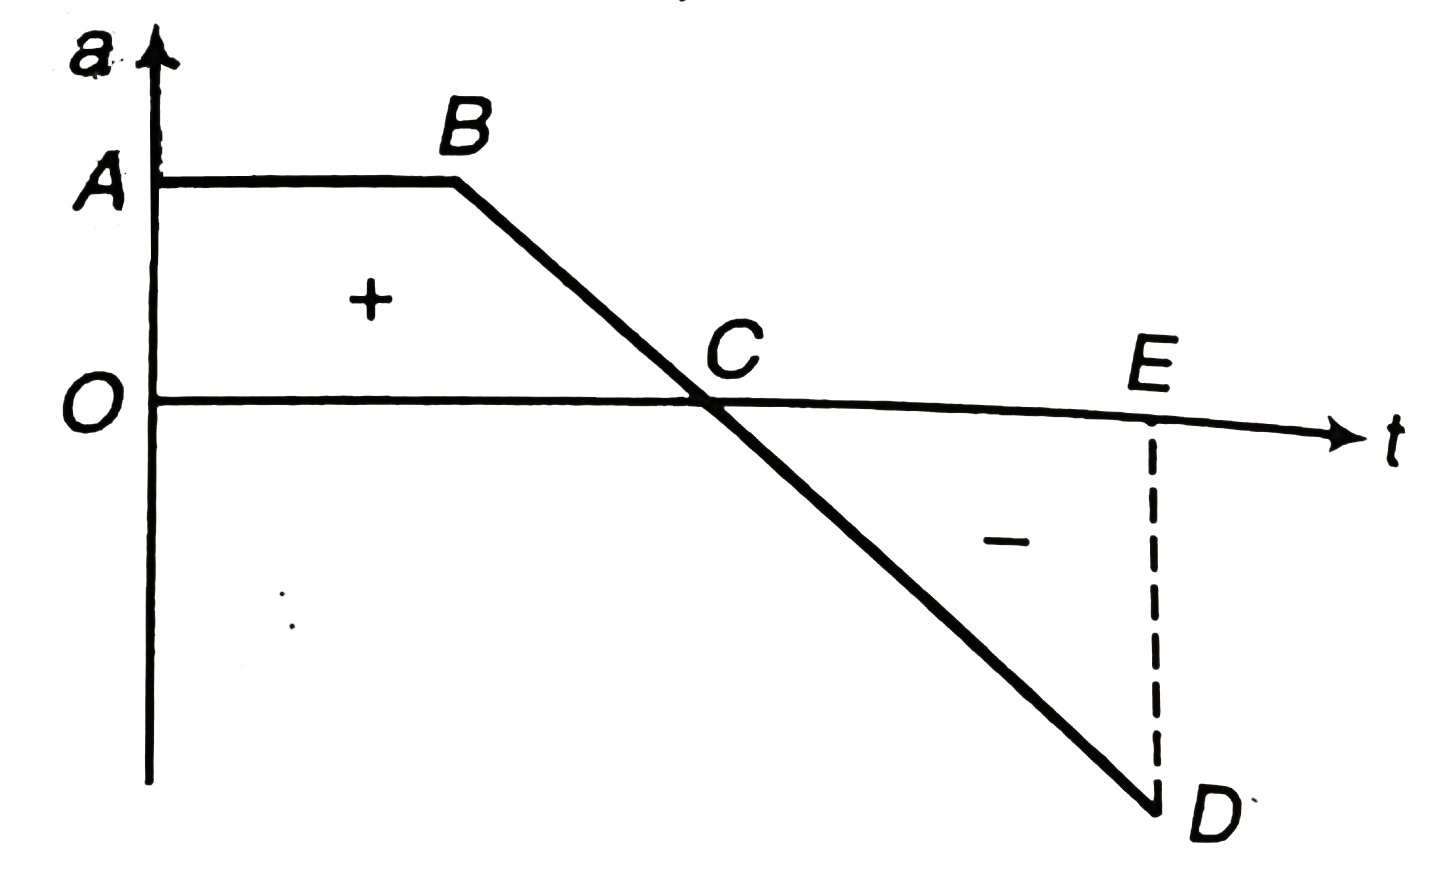
- Figure shows the acceleration-time graph of a particle moving along a ...
Text Solution
|
- Velocity-time graph of a particle moving in a straight line is shown i...
Text Solution
|
- Two particles 1 and 2 are thrown in the directions shown in figure sim...
Text Solution
|
- A ball is thrown vertically upward from the 12 m level with an initial...
Text Solution
|
- An automobile and a truck start from rest at the same instant, with th...
Text Solution
|
- Given |Vbr| = 4 m//s = magnitude of velocity of boatman with respect t...
Text Solution
|
- An aeroplane has to go from a point P to another point Q, 1000 km away...
Text Solution
|
- A train stopping at two stations 4 km apart takes 4 min on the journey...
Text Solution
|
- When a man moves down the inclined plane with a constant speed 5 ms^-1...
Text Solution
|
- Equation of motion of a body is (dv)/(dt) = -4v + 8, where v is the ve...
Text Solution
|
- Two particles A and B are placed in gravity free space at (0, 0, 0) m ...
Text Solution
|
- Velocity of the river with respect to ground is given by v0. Width of ...
Text Solution
|
- The relation between time t and displacement x is t = alpha x^2 + beta...
Text Solution
|
- A street car moves rectilinearly from station A to the next station B ...
Text Solution
|
- A particle of mass m moves on positive x-axis under the influence of f...
Text Solution
|
- A partial along a straight line whose velocity-displacement graph is a...
Text Solution
|
- A particle is falling freely under gravity. In first t second it cover...
Text Solution
|
- A rod AB is shown in figure. End A of the rod is fixed on the ground. ...
Text Solution
|