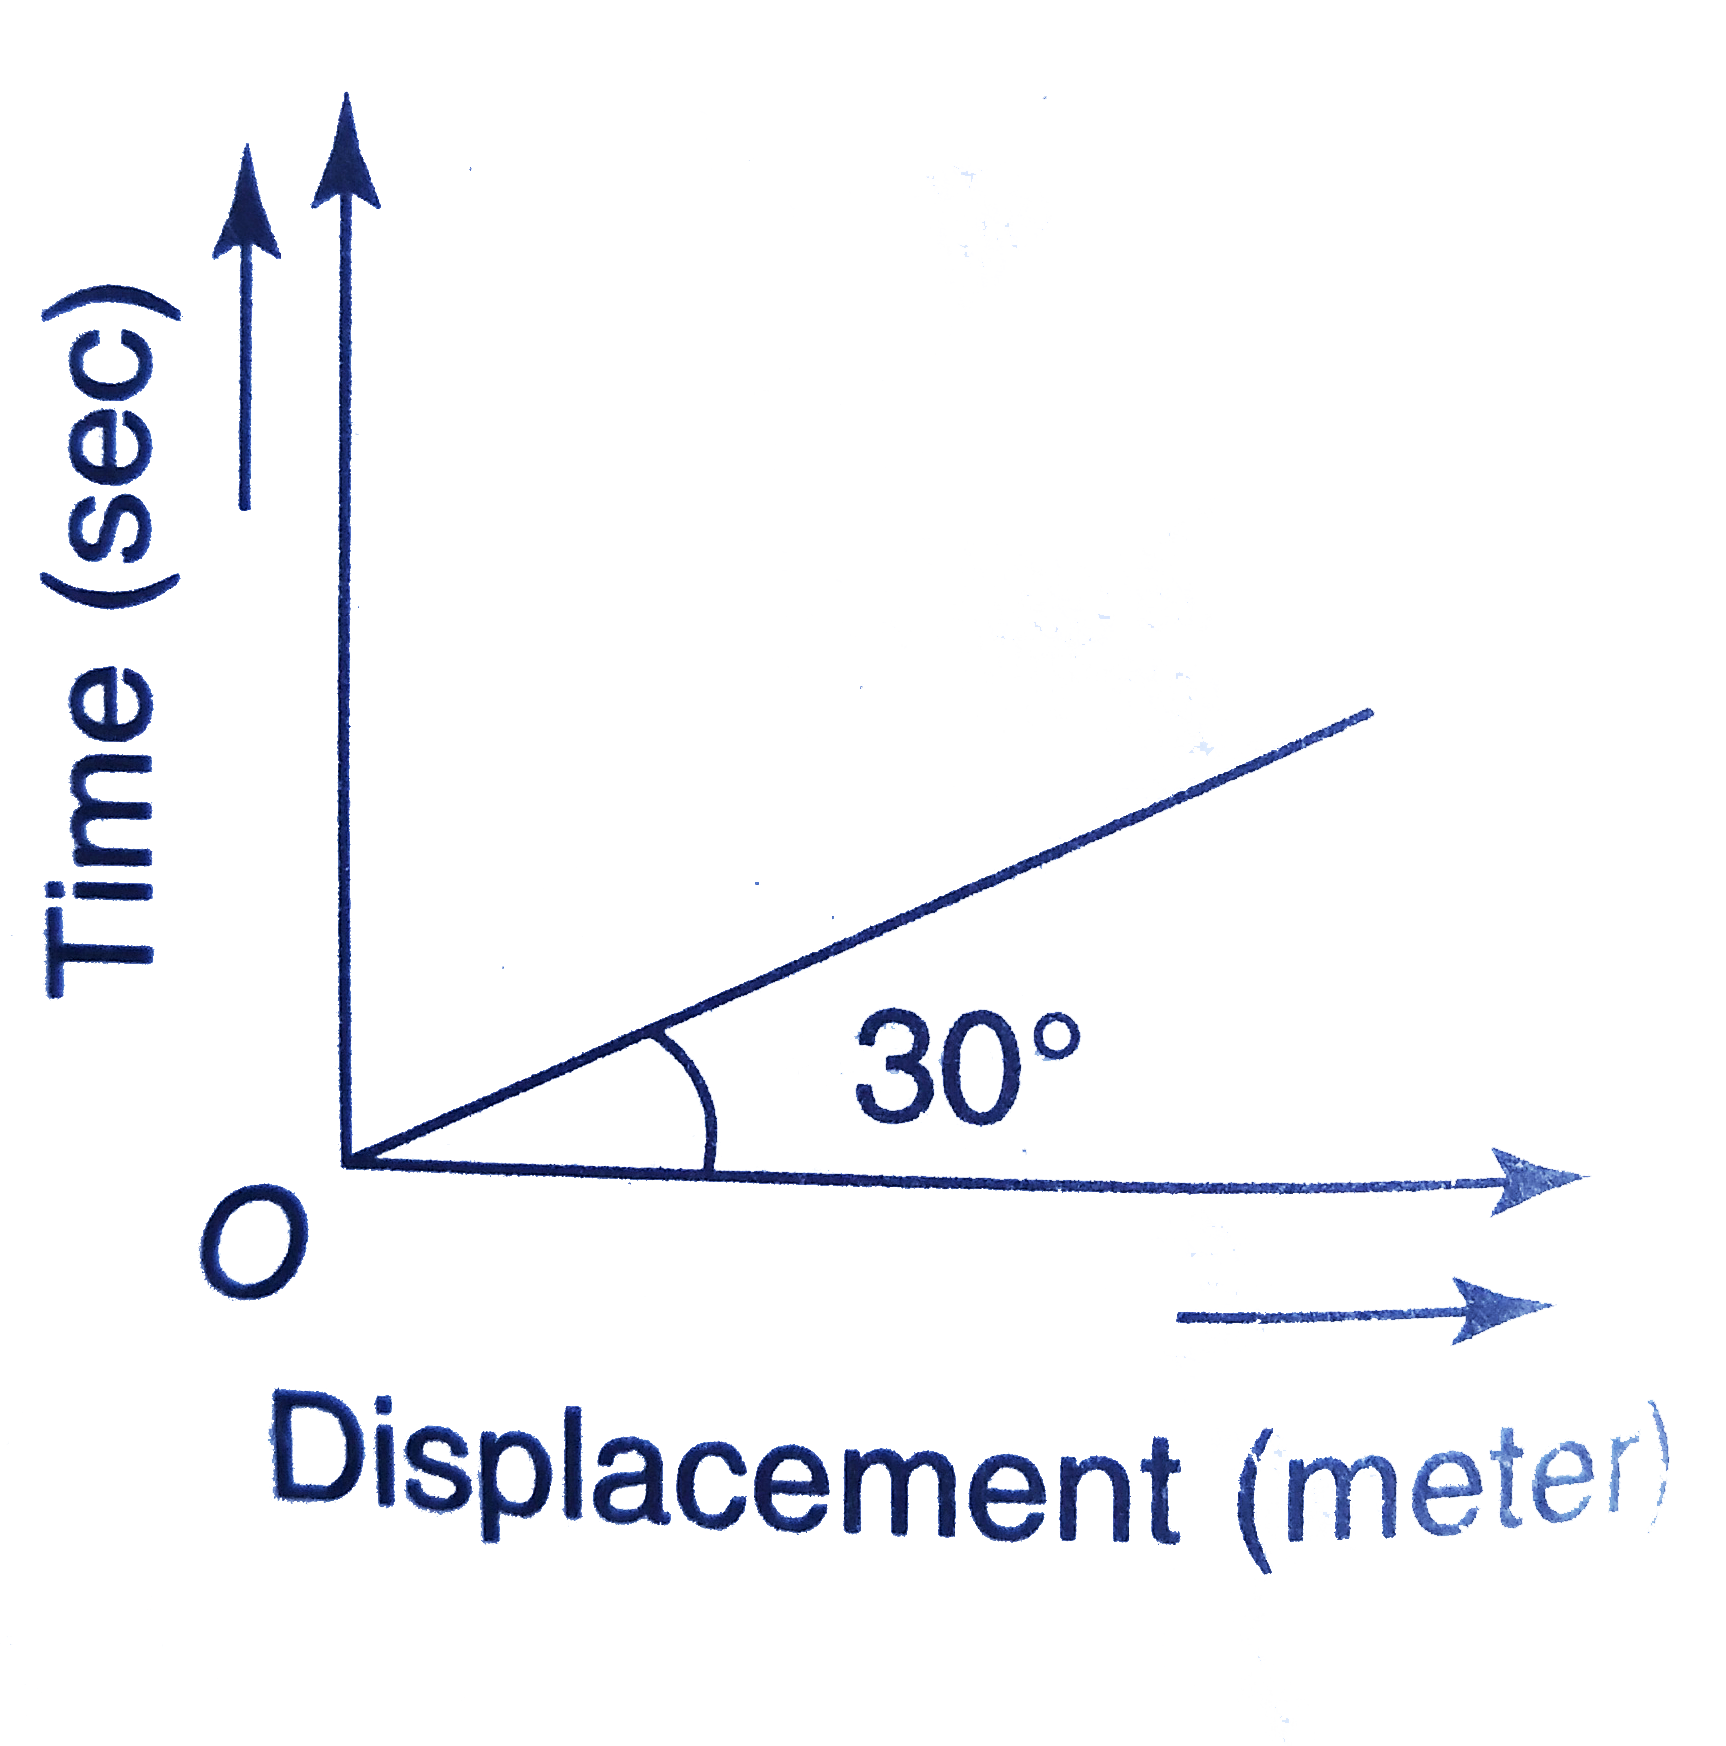
A
B
C
D
Text Solution
Verified by Experts
The correct Answer is:
Topper's Solved these Questions
MOTION IN A PLANE
DC PANDEY ENGLISH|Exercise Check point 3.7|15 VideosMOTION IN A PLANE
DC PANDEY ENGLISH|Exercise (A) Taking it together|75 VideosMOTION IN A PLANE
DC PANDEY ENGLISH|Exercise Check point 3.5|25 VideosMOTION
DC PANDEY ENGLISH|Exercise Medical entrances gallery|19 VideosPROJECTILE MOTION
DC PANDEY ENGLISH|Exercise Level - 2 Subjective|10 Videos
Similar Questions
Explore conceptually related problems
DC PANDEY ENGLISH-MOTION IN A PLANE-Check point 3.6
- Which of the following graph represents uniform motion
Text Solution
|
- From the following displacement-time graph find out the velocity of a ...
Text Solution
|
- The distance time graph of a particle at time t makes angle 45^(@) wit...
Text Solution
|
- The graph between displacement and time for a particle moving with uni...
Text Solution
|
- The v -t graph of a moving object is given in figure. The maximum acce...
Text Solution
|
- The variation of velocity of a particle with time moving along a strai...
Text Solution
|
- A lift is going up. The variation in the speed of the lift is as given...
Text Solution
|
- System is shown in the figure. Velocity of sphere A is 9 (m)/(s). Find...
Text Solution
|
- The x-t equation is given as x=2t+1. The corresponding v-t graph is
Text Solution
|
- Which of the following graph correctly represents velocity-time relati...
Text Solution
|
- A particle is thrown vertically upwards with a velocity v. It returns ...
Text Solution
|
- The velocity time graph of a body is shown in fig. it indicates that :
Text Solution
|
- The velocity - time graph is shown in the figure, for a particle. The ...
Text Solution
|
- The v-t plot of a moving object ios shown in the figure. The average v...
Text Solution
|
- Which of the following graphs cannot possibly represent one dimensiona...
Text Solution
|
- If the velocity v of particle moving along a straight line decreases l...
Text Solution
|
- v^(2) versus s-graph of a particle moving in a straight line is shown ...
Text Solution
|
- A graph between the square of the velocity of a particle and the dista...
Text Solution
|
- The area under acceleration-time graph represents the
Text Solution
|
- A particle starts from rest at t= 0 and undergoes and acceleration (a...
Text Solution
|
