


Topper's Solved these Questions
Similar Questions
Explore conceptually related problems
ICSE-HEAT-EXERCISE (PICTURE)
- Give reason Why does the balloon inflate when the bottle is put in h...
Text Solution
|
- Give reason Why do the pooris puff up in hot oil?
Text Solution
|
- Name the change of state that happens in the following picture
Text Solution
|
- Name the change of state that happens in the following picture
Text Solution
|
- Name the change of state that happens in the following picture
Text Solution
|
- When paper is tightly rolled around an iron bar and then placed in a f...
Text Solution
|
- Telephone lines are laid in different ways in winter and summer. Expla...
Text Solution
|
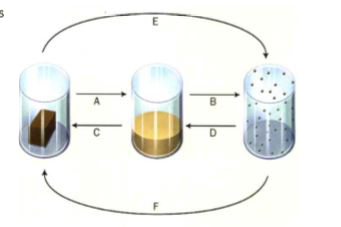
- Write phase changes in the diagram.
Text Solution
|
- What is the name of the metallic strip shown alongside? Where is it us...
Text Solution
|
- When a beaker of water is heated with a bit of potassium permanganate ...
Text Solution
|