A
B
C
D
Text Solution
AI Generated Solution
The correct Answer is:


Similar Questions
Explore conceptually related problems
Recommended Questions
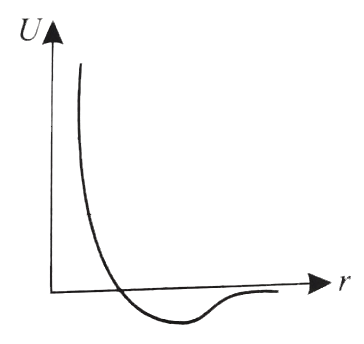
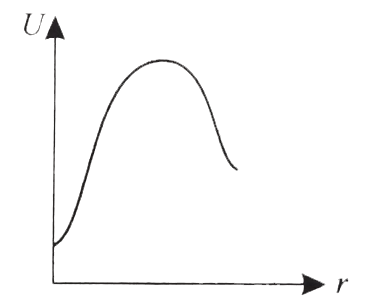
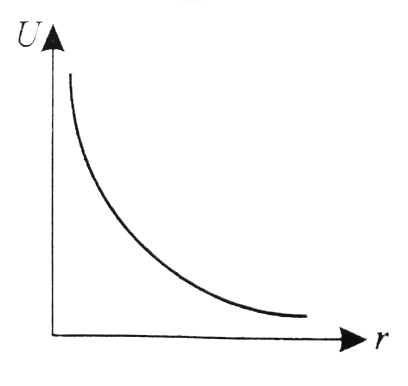
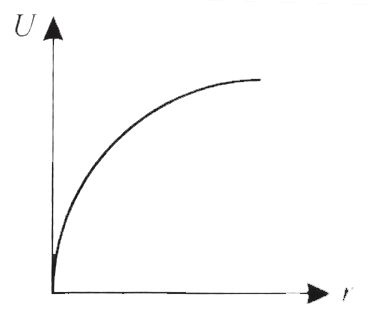
- These diagrams represent the potential energy U of a diatomic molecule...
Text Solution
|
- The potential energy function for a diatomic molecule is U(x) =(a)/(x^...
Text Solution
|
- The potential energy U of diatomic molecules as a function of separati...
Text Solution
|
- The potential energy function for the force between two atoms in a dia...
Text Solution
|
- These diagrams represent the potential energy U of a diatomic molecule...
Text Solution
|
- the points of maximum and minimum attraction in the curve between pote...
Text Solution
|
- The potential energy function for the force between two atoms in a dia...
Text Solution
|
- The potential energy function for the force between two atoms in a dia...
Text Solution
|
- एक द्विपरमानुक अणु में दो परमाणुओं के बीच लग रहे बल के लिए स्थितिज ऊ...
Text Solution
|