Home
Class 12
PHYSICS
The acceleration- time graph of a partic...

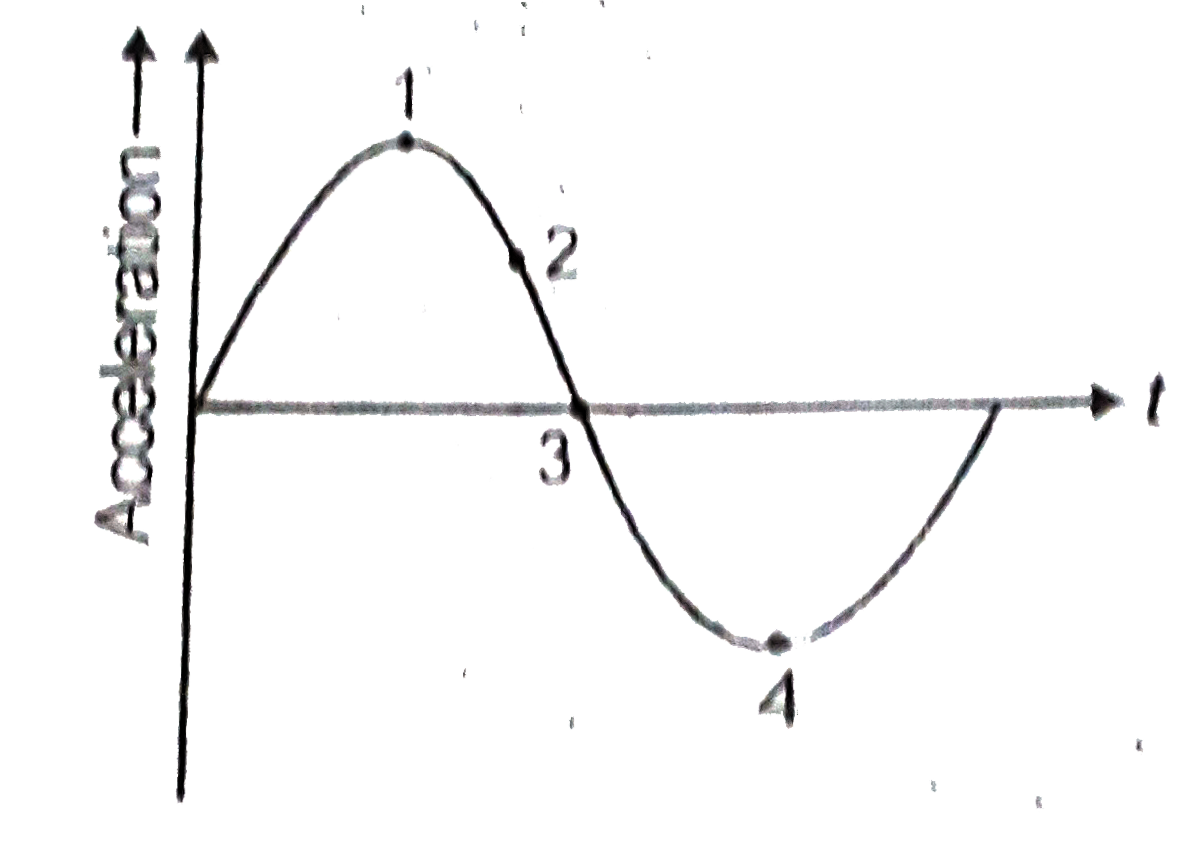
The acceleration- time graph of a particle executing SHM along x-axis is shown in figure. Match Column-I with column-II

`{:(,"Column-I",,"Column-II"),(,"Position of particle",,"Physical,quantites related with particle's motion"),((A),"At position 1 ",(p) ,"Kinetic energy is maximum"),((B ) ,"At position 2 ","q","Potential energy is maximum"),((C ), "At position 3",(r ),"Displacement of particle is negative"),((D),"At position 4",(s),"Velocity is maximum"):}`

Text Solution

Verified by Experts

The correct Answer is:
`A(q,r), B(r ) , C(p,s),D(q)`
Doubtnut Promotions Banner Mobile Dark
|

Topper's Solved these Questions

  • OSCILLATIONS

    AAKASH INSTITUTE ENGLISH|Exercise ASSIGNMENT ( Section-G( Integers Answer Type Question) )|4 Videos
  • OSCILLATIONS

    AAKASH INSTITUTE ENGLISH|Exercise ASSIGNMENT ( SECTION-H ( MULTIPLE TRUE-FALSE TYPE QUESTIONS) )|3 Videos
  • OSCILLATIONS

    AAKASH INSTITUTE ENGLISH|Exercise ASSIGNMENT ( SECTION-E(ASSERTION-REASON TYPE QUESTION) )|13 Videos
  • NUCLEI

    AAKASH INSTITUTE ENGLISH|Exercise ASSIGNMENT (SECTION-D)|10 Videos
  • PHYSICAL WORLD

    AAKASH INSTITUTE ENGLISH|Exercise ASSIGNMENT (Section-B)|4 Videos

Similar Questions

Explore conceptually related problems
The position-time graph for two particles P and Q moving on x-axis is shown in the figure. Then

Displacement time graph of particle performing SHM is as shown in figure. Assume that mean position is at x=0

The position (X)-time (t) graph for a particle of mass 1 kg moving along x-axis is shown in figure. Find impulse on particle at t = 4 s.

The velocity time graph of a particle executing SHM is shown. The maximum acceleration of the particle is npi m//s^2 , where n is______.

Position-time graph for a particle moving along x- direction is as shown in the figure. Average speed of the particle from t = 0 to t = 4 is :

The velocity –position graph of a particle moving along a straight line is shown. Then acceleration of the particle at s = 15 m is :

The velocity (v) - time (t) graph for a particle moving along x - axis is shown in the figure. The corresponding position (x) - time (t) is best represented by

In the following picture write down the position where i. Potential energy is maximum ii. Kinetic energy is maximum.

If A is amplitude of a particle in SHM, its displacement from the mean position when its kinetic energy is thrice that to its potential energy

Ratio of kinetic energy at mean position to potential energy at A/2 of a particle performing SHM