A
B
C
D
Text Solution
Verified by Experts
The correct Answer is:


Similar Questions
Explore conceptually related problems
Recommended Questions
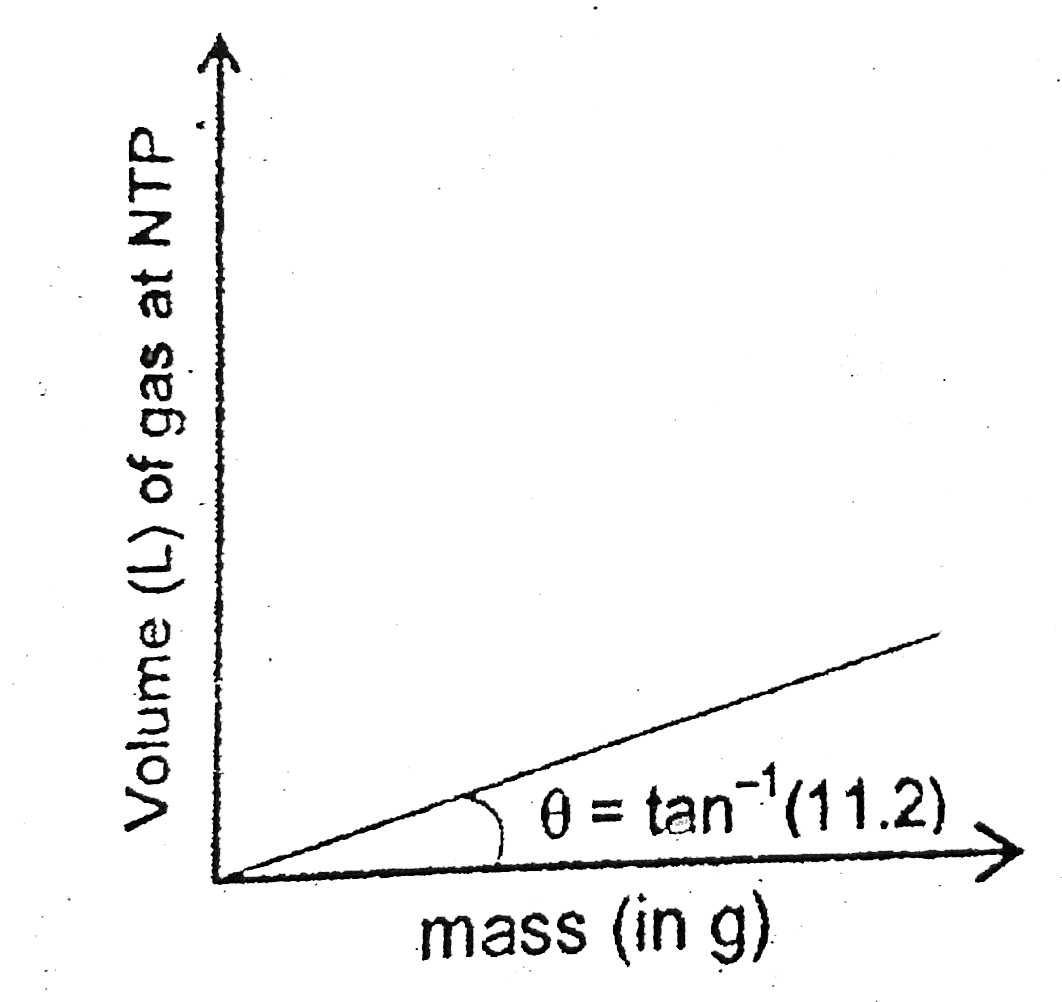
- A graph is plotted for gas 'C' , by putting its weight (in gm) on X-ax...
Text Solution
|
- The pressure p for a gas is plotted against its absolute temperature T...
Text Solution
|
- A graph is plotted for gas 'C' , by putting its weight (in gm) on X-ax...
Text Solution
|
- A graph is plotted with PV/T on y-axis and mass of the gas along x-axi...
Text Solution
|
- For fixed amount of ideal gas In P (y-axis) us In B (x-axis) curve is ...
Text Solution
|
- A sample of mono-atomic ideal gas is taken through a cyclic process AB...
Text Solution
|
- At NTP , 5.6 L of a gas weight 8 g . The vapour density of gas is :-
Text Solution
|
- For a real gas which obeys van der waals equation, a graph is obtained...
Text Solution
|
- A graph is plotted for an element, by putting its weight on X-axis and...
Text Solution
|