To determine which graph indicates that the average velocity of a particle moving along a straight line for the time interval \( (0, t) \) must be negative, we need to analyze the graphs based on the concept of average velocity.
### Step-by-Step Solution:
1. **Understanding Average Velocity**:
Average velocity (\( V_{\text{avg}} \)) is defined as the change in position (\( \Delta s \)) divided by the change in time (\( \Delta t \)):
\[
V_{\text{avg}} = \frac{\Delta s}{\Delta t}
\]
Here, \( \Delta s = s(t) - s(0) \) and \( \Delta t = t - 0 = t \).
2. **Analyzing Graphs**:
We need to evaluate each graph to see if the change in position (\( \Delta s \)) is negative over the time interval \( (0, t) \).
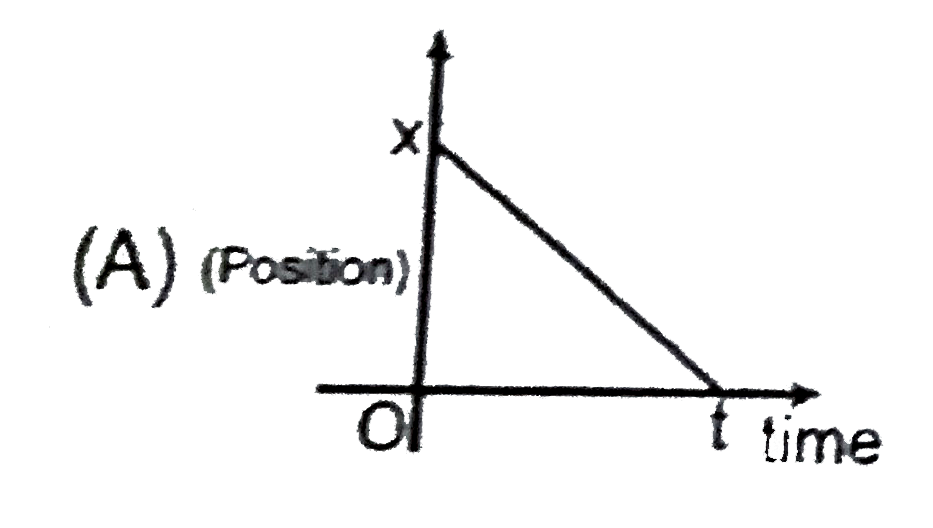
- **Graph 1 (Position vs. Time)**:
- If the graph shows a downward slope (i.e., the position decreases as time increases), then \( \Delta s < 0 \). This indicates that the average velocity is negative.
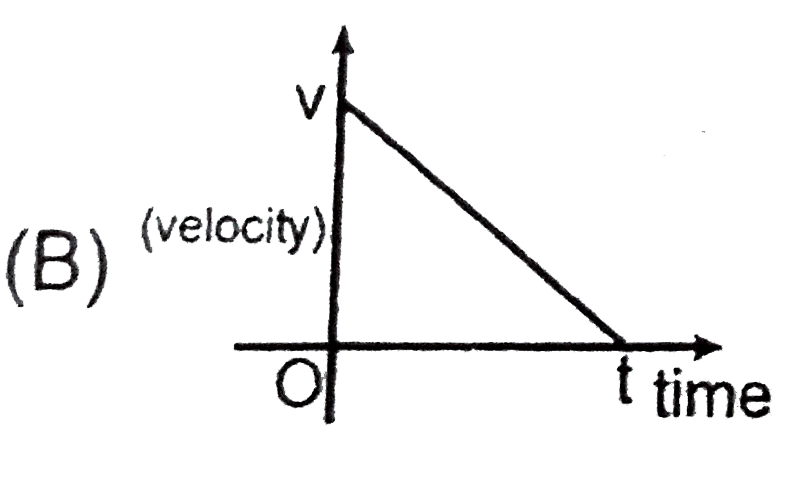
- **Graph 2 (Velocity vs. Time)**:
- For a velocity vs. time graph, the area under the curve represents the displacement. If the entire area is above the time axis (positive velocity), then \( \Delta s > 0 \) and \( V_{\text{avg}} > 0 \). Thus, this graph cannot represent a negative average velocity.
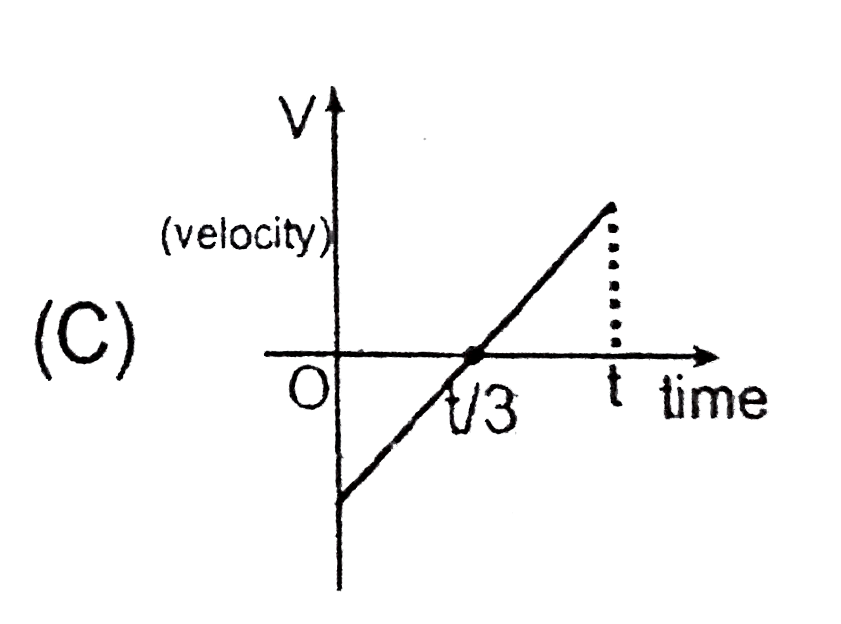
- **Graph 3 (Velocity vs. Time)**:
- If this graph has both positive and negative areas, we need to compare the areas. If the positive area is greater than the negative area, then \( \Delta s > 0 \). If the negative area is greater, then \( \Delta s < 0 \). However, if the positive area is greater, \( V_{\text{avg}} > 0 \).
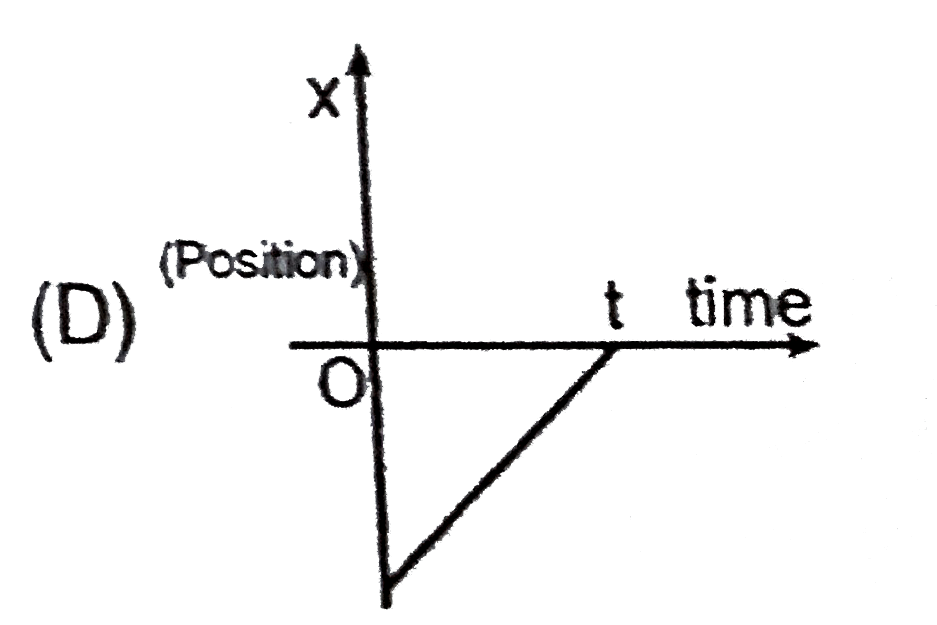
- **Graph 4 (Position vs. Time)**:
- Similar to Graph 1, if this graph shows a downward slope, then \( \Delta s < 0 \), indicating a negative average velocity.
3. **Conclusion**:
After analyzing all the graphs:
- **Only the first graph** shows a negative average velocity because it represents a decrease in position over time, leading to \( \Delta s < 0 \).
### Final Answer:
The graph for which the average velocity of a particle moving along a straight line for the time interval \( (0, t) \) must be negative is **Graph 1**.