To determine how the terminal velocity \( V \) of a spherical object varies with its radius \( r \), we can start by using the formula for terminal velocity in a viscous fluid:
\[
V = \frac{2}{9} \frac{g r^2 (\sigma - \rho)}{\eta}
\]
Where:
- \( V \) is the terminal velocity,
- \( g \) is the acceleration due to gravity,
- \( r \) is the radius of the object,
- \( \sigma \) is the density of the object,
- \( \rho \) is the density of the fluid,
- \( \eta \) is the coefficient of viscosity.
### Step 1: Identify the constants
In the context of the problem, we can identify that \( g \), \( \sigma \), \( \rho \), and \( \eta \) are constants for a given scenario. Therefore, we can simplify our equation to focus on the relationship between \( V \) and \( r \).
### Step 2: Simplify the equation
Since \( g \), \( \sigma \), \( \rho \), and \( \eta \) are constants, we can rewrite the equation as:
\[
V = K r^2
\]
Where \( K = \frac{2}{9} \frac{g (\sigma - \rho)}{\eta} \).
### Step 3: Analyze the relationship
The equation \( V = K r^2 \) indicates that terminal velocity \( V \) is directly proportional to the square of the radius \( r \). This is a quadratic relationship.
### Step 4: Graph the relationship
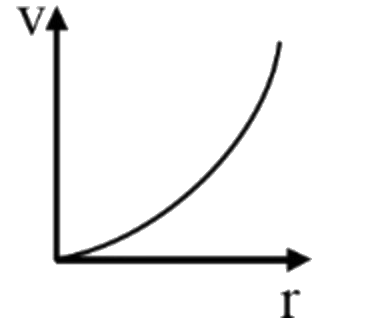
To graph this relationship, we note that it resembles the form \( y = ax^2 \), where \( y \) corresponds to \( V \) and \( x \) corresponds to \( r \). The graph of a quadratic function is a parabola that opens upwards.
### Step 5: Identify the correct graph
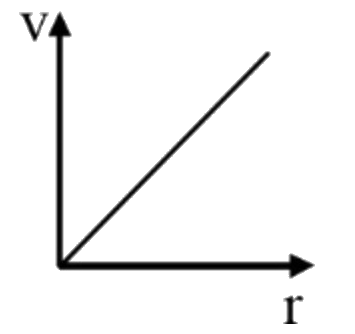
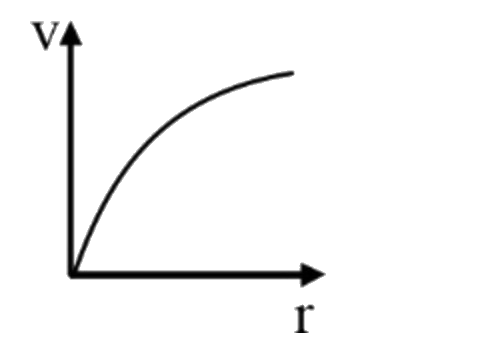
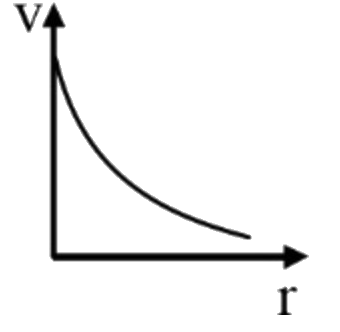
From the options provided, we need to choose the graph that represents a quadratic relationship between \( V \) and \( r \). The correct graph will show a parabolic curve indicating that as the radius increases, the terminal velocity increases with the square of the radius.
### Conclusion
Thus, the correct graph that represents the relationship between terminal velocity \( V \) and radius \( r \) is the one that shows a parabolic curve.
---


