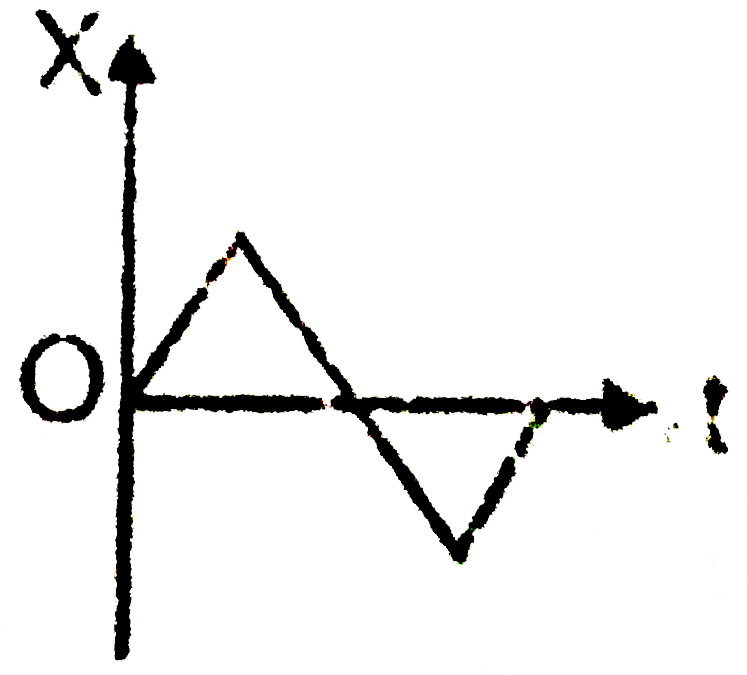
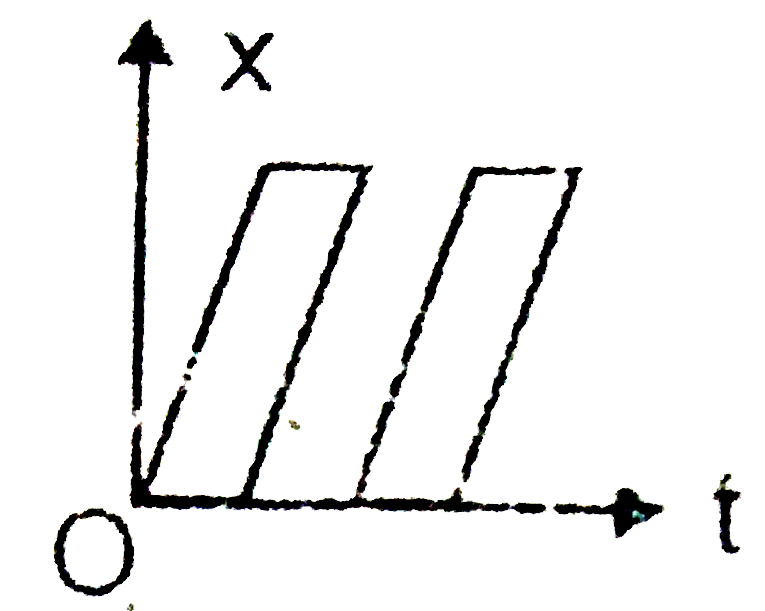
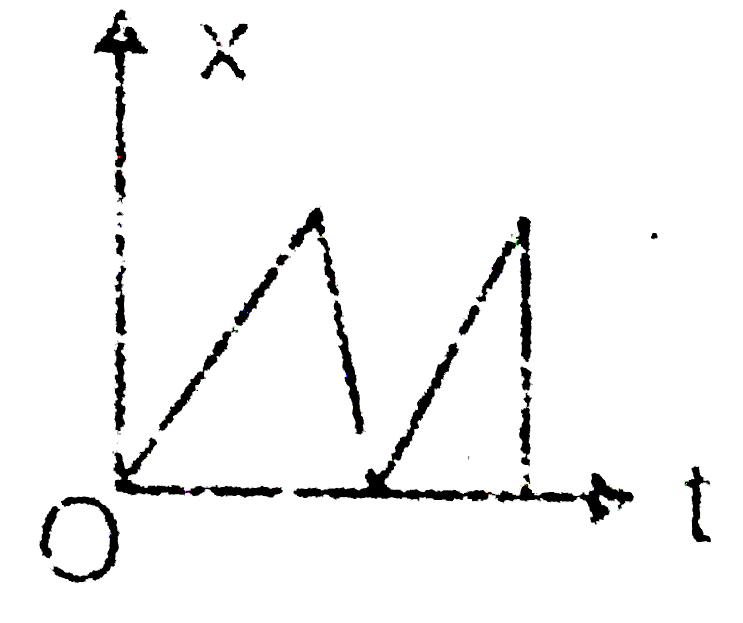
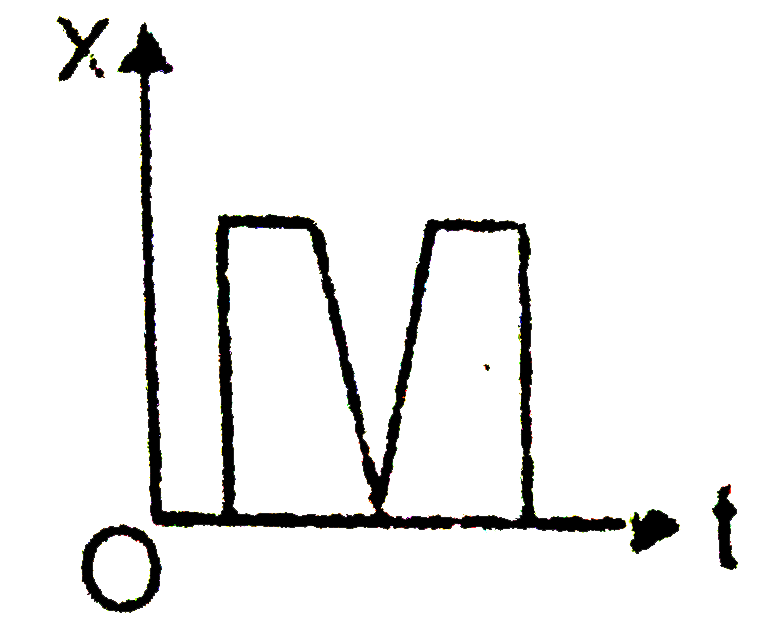
Home
Class 12
PHYSICS
Which of the following displacement (X) ...

Which of the following displacement (X) time graphs is not possible?

A

B

C

D

Text Solution

AI Generated Solution

The correct Answer is:
To determine which of the given displacement-time graphs is not possible, we need to analyze the characteristics of each graph. Here’s a step-by-step solution: ### Step 1: Understand the Displacement-Time Graph Displacement-time graphs represent the position of an object over time. The slope of the graph indicates the velocity of the object. A straight line indicates constant velocity, while a curved line indicates changing velocity. ### Step 2: Analyze Each Graph 1. **Graph A**: If this graph shows a point where the displacement is the same for two different times, it implies that the object has two displacements at the same time, which is not physically possible. 2. **Graph B**: If this graph shows a vertical line (where time remains constant but displacement changes), it implies an infinite velocity (as velocity = displacement/time). This is also not possible in physical terms, as it would require infinite acceleration. 3. **Graph C**: If this graph shows a linear relationship with time, it indicates constant velocity. This is a possible scenario in physics. 4. **Graph D**: If this graph shows a piecewise linear graph with different slopes, it indicates changing velocities at different intervals. This is also a possible scenario. ### Step 3: Conclusion From the analysis, Graph A and Graph B are not possible. However, Graph A is particularly problematic because it suggests two displacements at the same time, which is a clear violation of the principles of physics. ### Final Answer The displacement-time graph that is not possible is Graph A. ---

To determine which of the given displacement-time graphs is not possible, we need to analyze the characteristics of each graph. Here’s a step-by-step solution: ### Step 1: Understand the Displacement-Time Graph Displacement-time graphs represent the position of an object over time. The slope of the graph indicates the velocity of the object. A straight line indicates constant velocity, while a curved line indicates changing velocity. ### Step 2: Analyze Each Graph 1. **Graph A**: If this graph shows a point where the displacement is the same for two different times, it implies that the object has two displacements at the same time, which is not physically possible. ...
Doubtnut Promotions Banner Mobile Dark
|

Similar Questions

Explore conceptually related problems

Which of the following distance time graphs is possible ?

Which of the following speed - time (v - t) graphs is physically not possible?

Knowledge Check

  • Which of the following displacement-time graphs represent damped harmonic oscillation?

    A
    B
    C
    D
  • Which one of the following represents displacement-time graph of two objects A and B moving with zero relative velocity?

    A
    B
    C
    D
  • Similar Questions

    Explore conceptually related problems

    Which of the following speed - time (upsilon-t) graph is physically possible ?

    In the following displacement (x) vs time (t) graph, at which among the point P,Q and R is the object speed increasing ?

    From the following displacement-time graph find out the velocity of a moving body.

    The motion of a body is represented by the following displacement-time graph. How can the velocity of the body be determined from the above graph?

    The motion of a body is represented by the following displacement-time graph. State the type of motion represented in the graph.

    What does the slope of a displacement-time graph represent?