Home
Class 12
MATHS
The graph of y = f(x) is as shown in th...

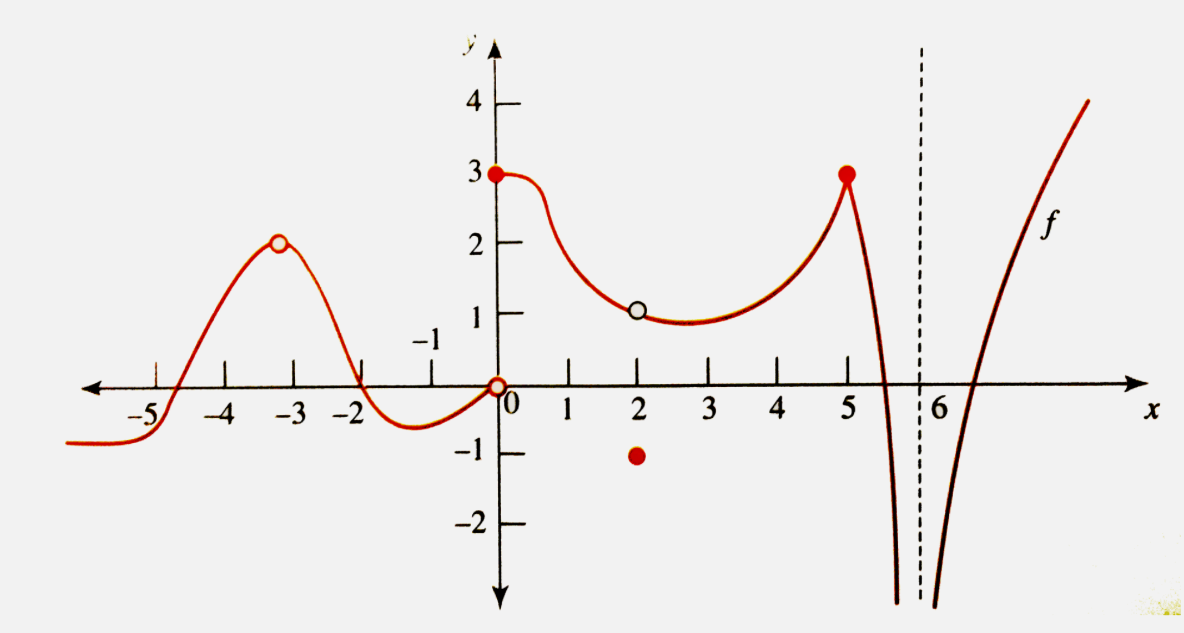
The graph of ` y = f(x)` is as shown in the following figure.

Identify the points of discontinuity and give the reason for the same.

Text Solution

Verified by Experts

y = f(x) is discontinuous at x =- 3 as the value of the function is missing at this point. Assigning proper value to f(-3) [from the graph f(-3) = 2], f(x) can be made continuous at this point.
y = f(x) is discontinuous at x = 0 as there is a jump in the value of the function at this point. Here ` underset(x to 0^(-))"lim" f(x) and underset(x to 0^(+))"lim" f(x) = 3`. At this point, the function cannot be made continuous.
At x = 2, the function is discontinuous as the value of the value of the function is not same as the limiting value of function.
That is, ` underset(x to 2) " lim" f (x) = 1` (limit of the function exists), but f(2) =- 1.
At x = 6, the function is discontinuous as the value of the function is decreasing indefinitely when x is approached from either its left or its right.
Doubtnut Promotions Banner Mobile Dark
|

Topper's Solved these Questions

  • GETTING STARTED WITH GRAPHS

    CENGAGE PUBLICATION|Exercise ILLUSTRATION 1.17|1 Videos
  • GETTING STARTED WITH GRAPHS

    CENGAGE PUBLICATION|Exercise ILLUSTRATION 1.18|1 Videos
  • GETTING STARTED WITH GRAPHS

    CENGAGE PUBLICATION|Exercise ILLUSTRATION 1.15|1 Videos
  • FUNCTIONS

    CENGAGE PUBLICATION|Exercise Comprehension Type|7 Videos
  • GRAPH OF INVERSE TRIGONOMETRIC FUNCTIONS

    CENGAGE PUBLICATION|Exercise Exercises|18 Videos

Similar Questions

Explore conceptually related problems
The graph of y=f(x) is as shown in the following figure. Draw the graph of y=[f(x)] .

The graph of y = f(x) is shown, find the number of solution of f(f(x)) = 2.

The graph of a function is shown in the following figure. Determine the intervals on which the function is concave up and the intervals on which it is concave down. Find the x - coordinates of any inflection points.

If the graph of y=|f(x)| is as shown in figure then the graph of y=f(x) may be

Consider the graph of y = f(x) as shown in the following figure. (i) Find the sum of the roots of the equation f (x) = 0. (ii) Find the product of the roots of the equation f(x) = 4. (iii) Find the absolute value of the difference of the roots of the equation f(x) = x+2 .

Graph of y = f(x) is as shown in the following figure. Find the roots of the following equations f(x) = 0 f(x) = 4 f(x) = x + 2

The graph of y = f(x) is as shown in the following figure. Find the following values (i) f(-3)" "(ii) f(-2)" "(iii) f(0) (iv) f(2)" "(v) f(3)" "(vi) lim_(x to -3) f(x) (vii) lim_(x to 0) f(x)" "(viii)lim_(x to 2) f(x)" "(ix) lim_(x to 3) f(x) (x) lim_(x to 2^(-)) f(x)" "(x i)lim_(x to -2^(+)) f (x)" "(x ii)lim_(x to 0^(-)) f(x) (x iii) lim_(x to 0^(+)) f(x)

The graph of the second derivation f''(x) is given in the following figure. State the x - coordinate of the point of inflection of f. Given reasons for your answer.

Find the points of discontinuity of the function: f(x)=1/(2sinx-1)

The graph of a function y=g(x) is shown in the following figure. If f(x)=-3x^2-k x-12 ,k in Ra n df(g(x))>0AAx in R then least integral value of k is equal to a. 13 b.64 c. 15 d.16