Home
Class 12
MATHS
The figure shows the graphs of f, f' and...

The figure shows the graphs of f, f' and f''. Indentify each curve and explain your choices.

Text Solution

Verified by Experts

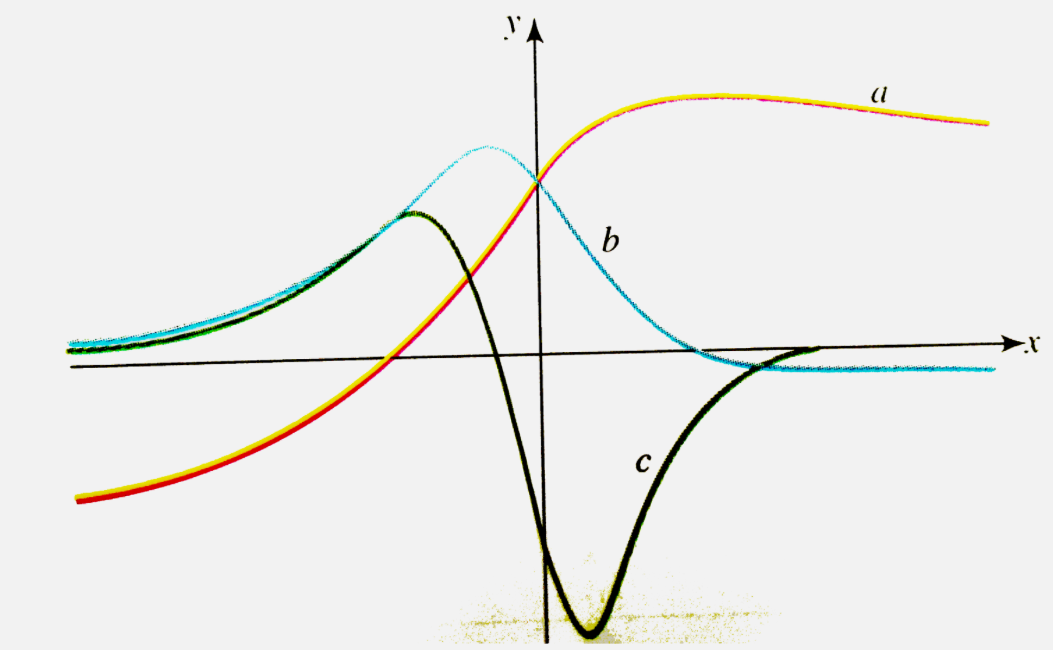
Clearly the graph 'a' and 'b' are lying entirely above the x-axis. Now for graph 'b', derivative becomes zero at point p.

For graph 'c', derivative becomes zero at x = q and x = r.
Now none of the graphs meets the x-axis at two points q and r.
Hence 'a' must be the graph of the derivative of graph 'b'. Also for x = p, the graph of 'a' meets the x-axis , which confirms this fact.
Let 'b' be the graph of y = f(x) and 'a' be the graph of y = f'(x) , then can 'c' be the graph of y = f''(x)?
Certainly not, as otherwise graph 'c' had cut the x-axis twice.
So 'c' is the graph of y=f(x). 'b' is the graph of y = f'(x) and 'a' is the graph of y = f''(x).
Also for graph 'c', the angle of tangent with + ve x -axis is acute and increases till the point x = p. After x = p and onwards, angle decreases but remains positive. Thus, the graph of y = f'(x) , which is graph is graph 'b' , line entirely above the x-axis. In other words. the graph of 'c' is entirely increasing, hence its derivative is positive, as a result graph 'b', which is the graph of y = f'(x), lies above x - axis.
So finally c is y = f(x), b is y = f'(x) and a = f'(x).
Doubtnut Promotions Banner Mobile Dark
|

Topper's Solved these Questions

  • GETTING STARTED WITH GRAPHS

    CENGAGE PUBLICATION|Exercise ILLUSTRATION 1.26|1 Videos
  • GETTING STARTED WITH GRAPHS

    CENGAGE PUBLICATION|Exercise ILLUSTRATION 1.27|1 Videos
  • GETTING STARTED WITH GRAPHS

    CENGAGE PUBLICATION|Exercise ILLUSTRATION 1.24|1 Videos
  • FUNCTIONS

    CENGAGE PUBLICATION|Exercise Comprehension Type|7 Videos
  • GRAPH OF INVERSE TRIGONOMETRIC FUNCTIONS

    CENGAGE PUBLICATION|Exercise Exercises|18 Videos

Similar Questions

Explore conceptually related problems

Draw the graph of f(x) = x|x| .

Draw the graph of f(x) = e^(sin x).

Draw the graph of f(x) = sqrt(sin x) .

Draw the graph of the function, f(x) = tan x.

The following figure shows the graph of f(x) =ax^(2)+bx +c , then find the sign of values of a, b and c .

The following figure shows the graph of f(x)= ax^(2)+ bx+c , find the signs of a, b and c .

Draw the graph of the function: f(x)=tanx

The figure illustrates the graph of the function y=f(x) defined in [-3, 2]. Identify the correct statement(s)?

Draw the graphs of the constant functions : f(x) = 0

Draw the graph of the function, f(x)=x^2 .