Home
Class 12
MATHS
The graph of y = f(x) is as shown in the...

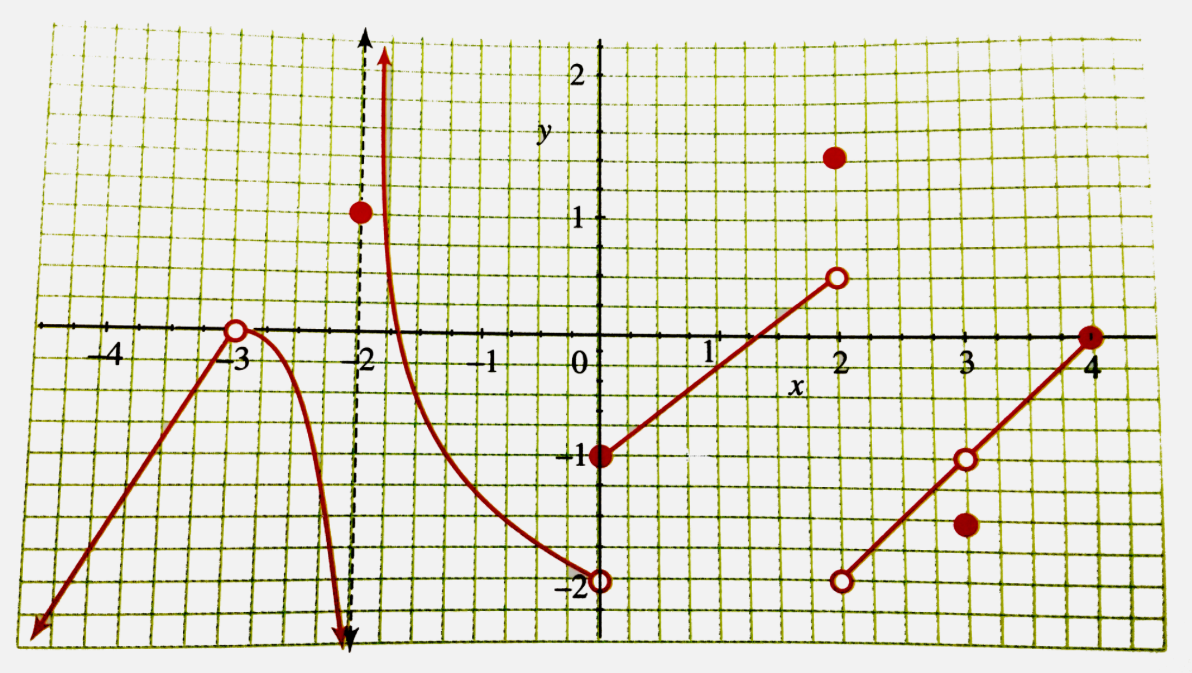
The graph of y = f(x) is as shown in the following figure.

Find the following values
(i)` f(-3)" "(ii) f(-2)" "(iii) f(0)`
(iv)` f(2)" "(v) f(3)" "(vi) lim_(x to -3) f(x)`
(vii)` lim_(x to 0) f(x)" "(viii)lim_(x to 2) f(x)" "(ix) lim_(x to 3) f(x)`
`(x) lim_(x to 2^(-)) f(x)" "(x i)lim_(x to -2^(+)) f (x)" "(x ii)lim_(x to 0^(-)) f(x)`
(x iii) `lim_(x to 0^(+)) f(x)`

Text Solution

Verified by Experts

(i) f(-3) does not exist `" "(ii) f(-2) = 1`
(iii)` f(0) =- 1" "(iv) f(2) = 1.5`
(v) ` f(3) =- 1.5" "(vi) underset(x to -3)"lim" f(x) = 0 = 0`
(vii)` underset(x to 0)"lim" f(x)"does not exist as "underset(x to -0^(-))"lim" f(x) =- 2 and underset(x to - 0^(+))"lim" f(x) =- 1`
(viii) `underset(x to 2)"lim" f(x)" does not exist as "underset( x to 2^(-))"lim" f(x) = 0.5 and underset(x to 2^(+))"lim" f(x) =- 2`
(i x) ` underset(x to 3)"lim" f(x) =- 1" "(x) underset(x to -2^(-))"lim" f(x) =- infty`
(x i)` underset(x to -2^(+))"lim" f(x) = infty" "(x ii) underset(x to -0^(-))" lim" f(x) =- 2`
(x iii)` underset(x to - 0^(+))"lim" f(x) =- 1`
Doubtnut Promotions Banner Mobile Dark
|

Topper's Solved these Questions

  • GETTING STARTED WITH GRAPHS

    CENGAGE PUBLICATION|Exercise Exercises 1.8|1 Videos
  • GETTING STARTED WITH GRAPHS

    CENGAGE PUBLICATION|Exercise Exercises 1.9|1 Videos
  • GETTING STARTED WITH GRAPHS

    CENGAGE PUBLICATION|Exercise Exercises 1.6|1 Videos
  • FUNCTIONS

    CENGAGE PUBLICATION|Exercise Comprehension Type|7 Videos
  • GRAPH OF INVERSE TRIGONOMETRIC FUNCTIONS

    CENGAGE PUBLICATION|Exercise Exercises|18 Videos

Similar Questions

Explore conceptually related problems
The graph of y=f(x) is as shown in the following figure. Draw the graph of y=[f(x)] .

Graph of y = f(x) is as shown in the following figure. Find the roots of the following equations f(x) = 0 f(x) = 4 f(x) = x + 2

Knowledge Check

  • If 3f(x) + 2f(-x) =5(x-2) , state which of the following is the value of f(0) :

    A
    0
    B
    `-2`
    C
    2
    D
    1
  • Similar Questions

    Explore conceptually related problems

    The graph of y = f(x) is shown, find the number of solution of f(f(x)) = 2.

    If the graph of y=|f(x)| is as shown in figure then the graph of y=f(x) may be

    Graph of y=f(x) and y=g(x) is given in the following figure. If h(x)= f(g(x)) , then find the value of h'(2) .

    The graph of the function y=f(x) is as shown in the figure. Then draw the graphs of (i) y=sgn(f(x)) (ii) y=|f(x)| (iii) y=x^(sgn(f(x)))

    Find the zero of the polynomial in each of the following cases. (i) f (x) = x +2 (ii) f (x) = x-2 (iii) f (x) =2x +3 (iv) f (x) =2x -3 (v) f (x) =x ^(2) (vi) f (x) = px, p ne 0 (vii) f (x) = px + q,p ne 0 pq are real numbers.

    A functionfis defined by f(x)=2x-5. Write down the values of (i) f(0), (ii) f(7), (iii) f(-3)

    Find the domain and range of the following functions. (i) f(x)=sqrt(2x-3) " (ii) " f(x) =(1)/(x-2) (iii) f(x) =x^(2) +3 " (iv) " f(x)=(1)/(x^(2)+2)