Text Solution
Verified by Experts


Topper's Solved these Questions
Similar Questions
Explore conceptually related problems
CENGAGE PUBLICATION-GRAPHS OF TRIGONOMETRIC FUNCTIONS-Exercises
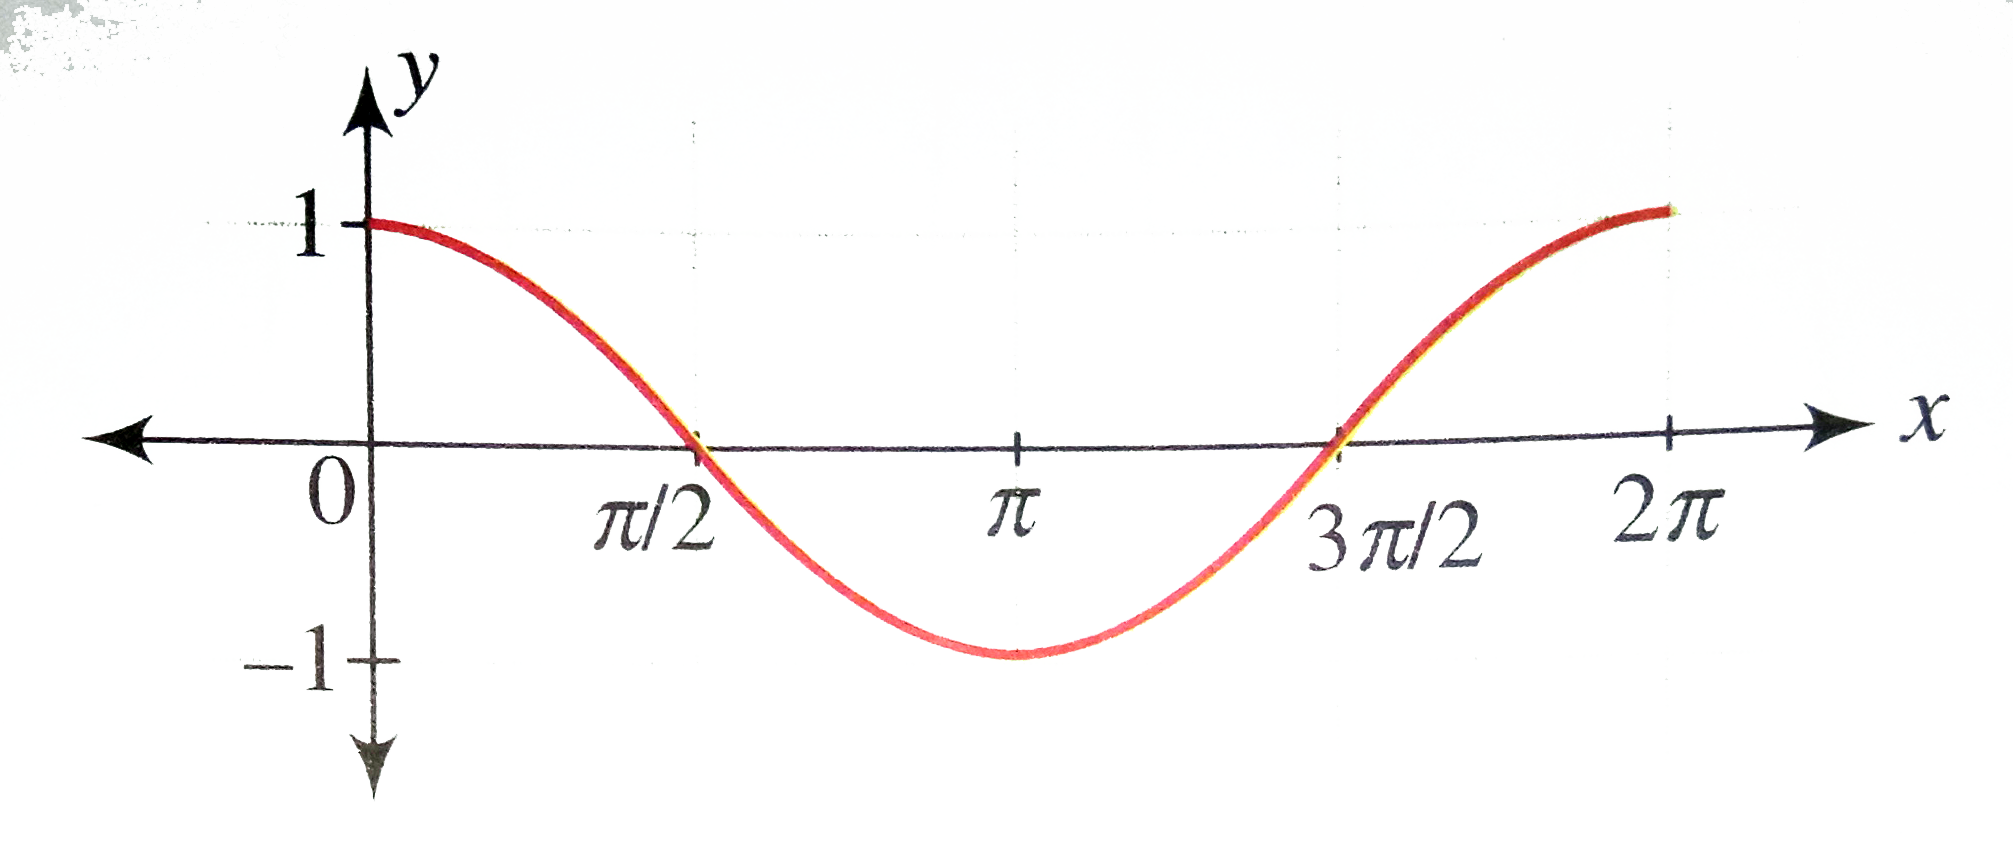
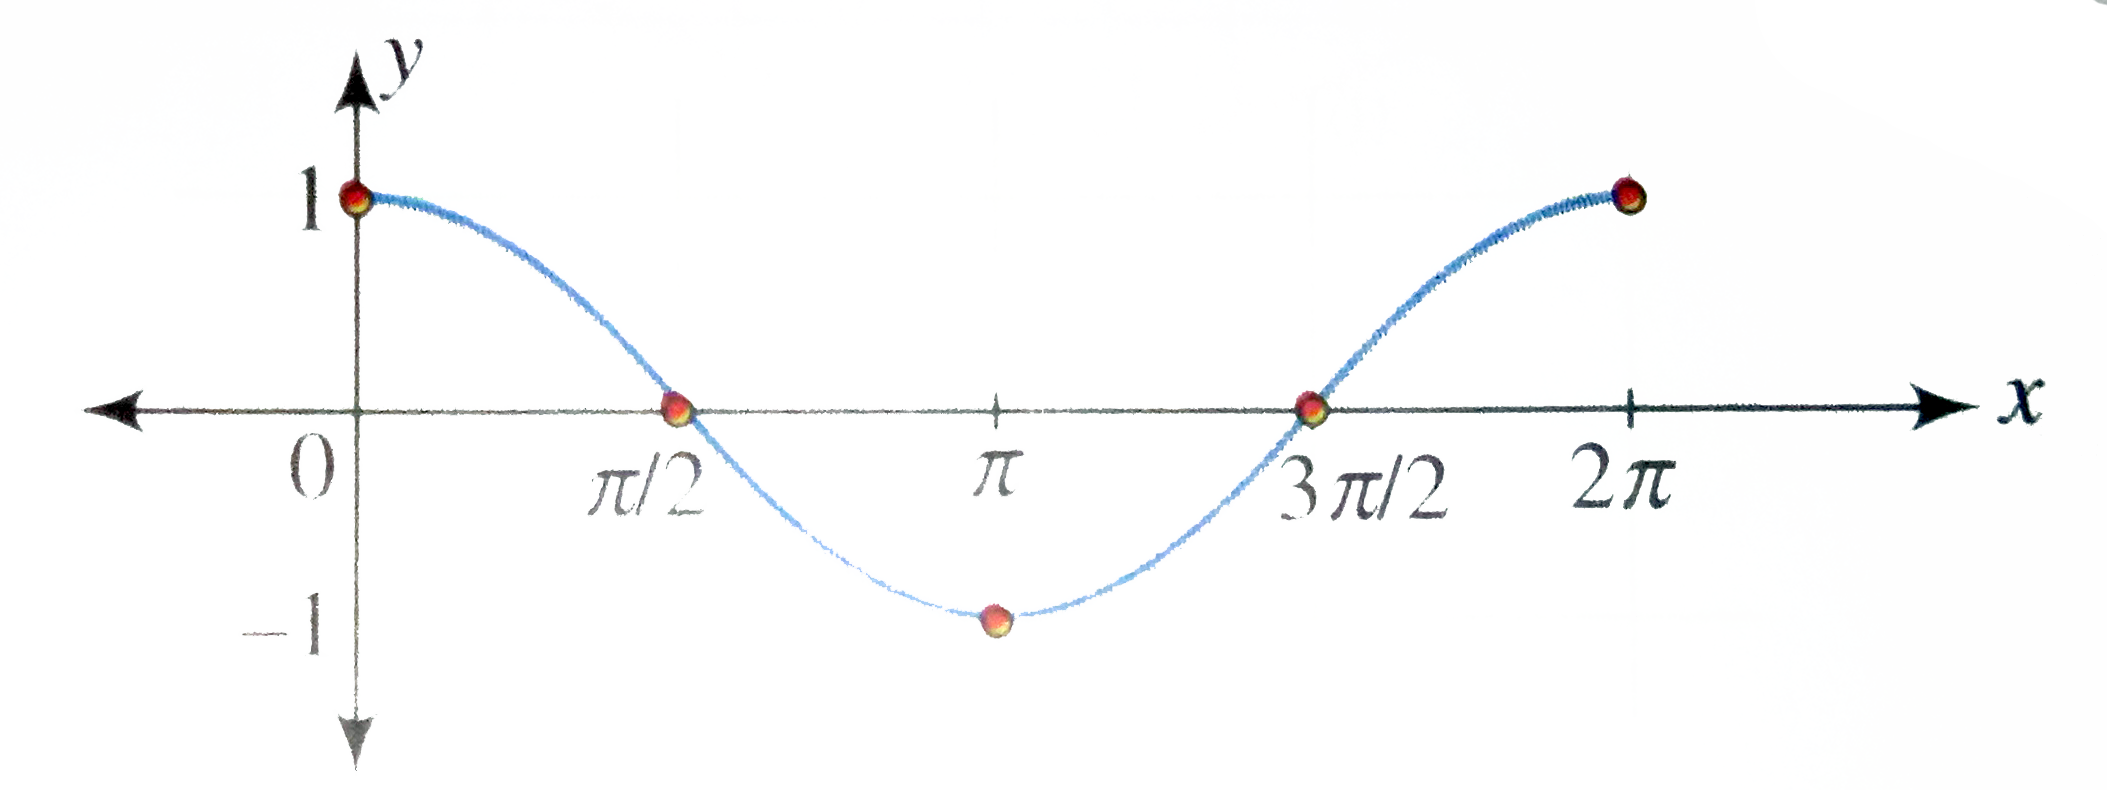
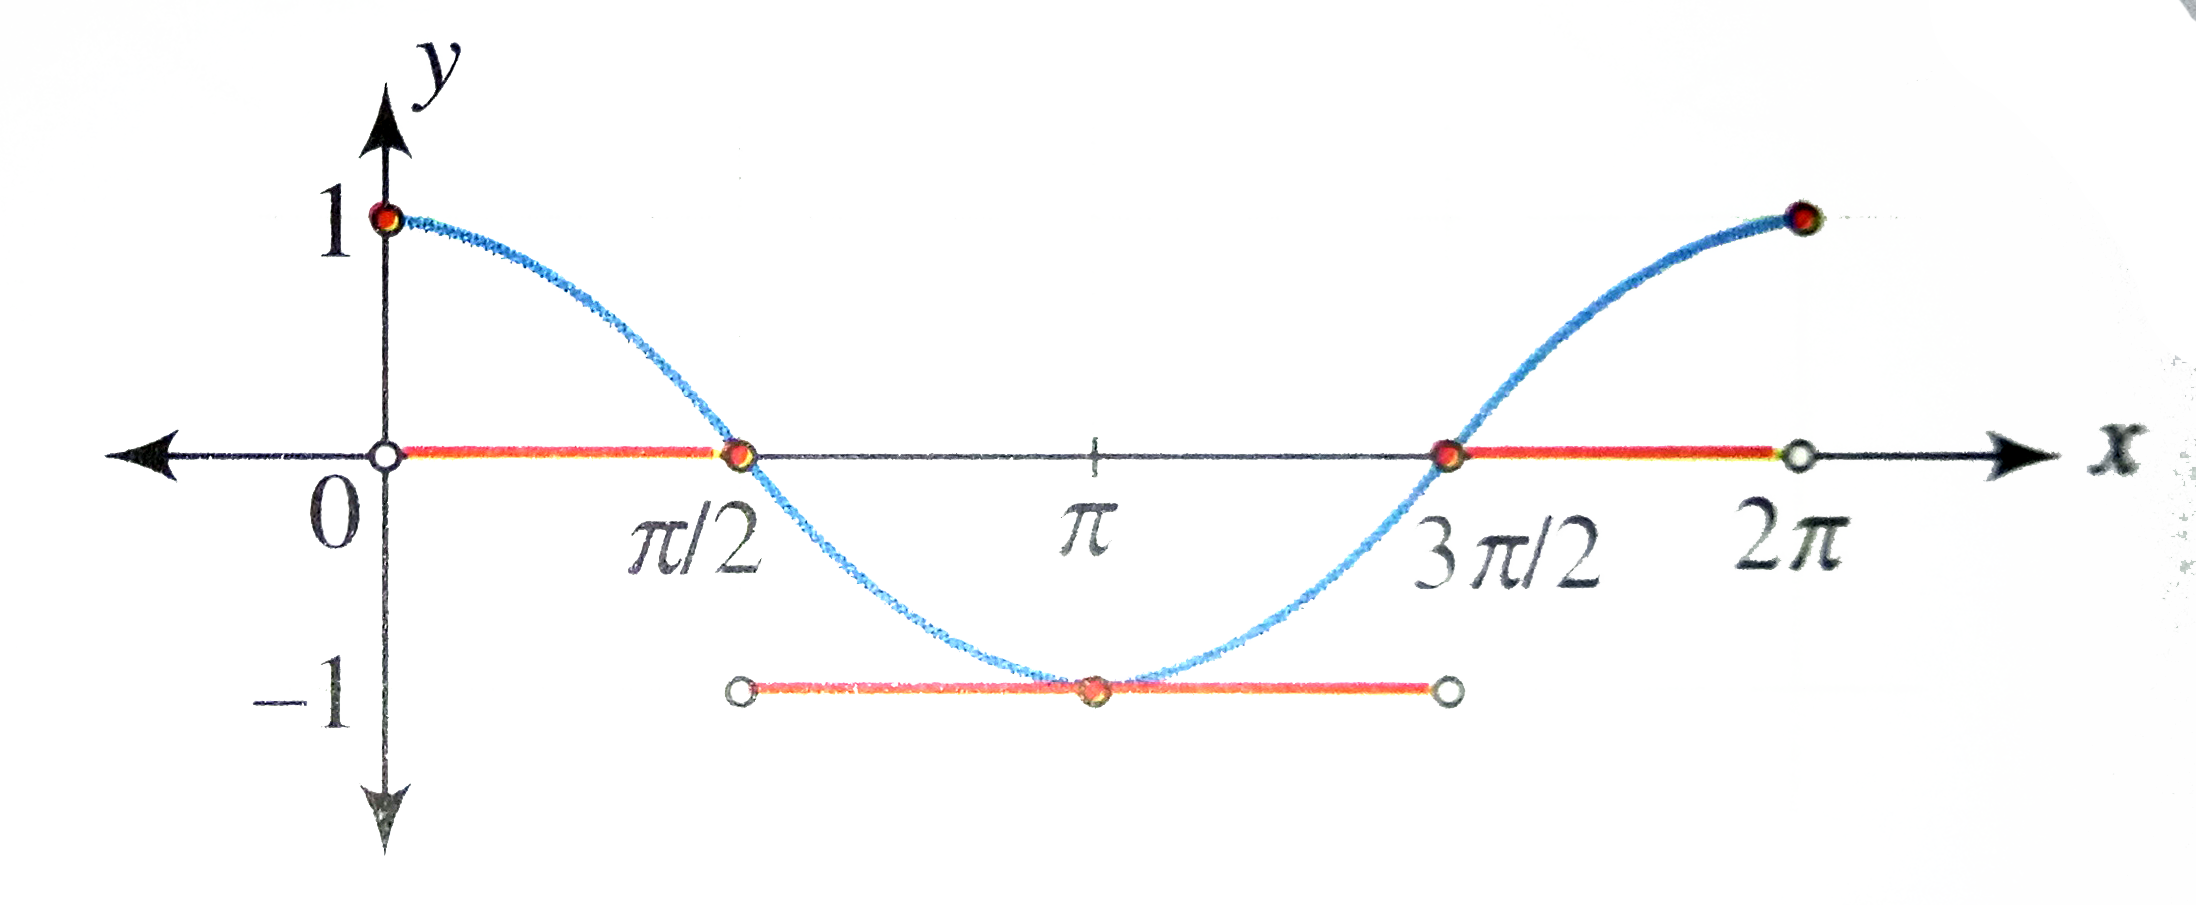
- Draw the graph of y = cos^(2)x.
Text Solution
|
- Find the value of x for which f(x)=sqrt(sinx-cosx) is defined, x in [0...
Text Solution
|
- Draw the graph of y = tan^(2) x.
Text Solution
|
- Draw the graph of y = sin x + cos x, x in [0, 2pi].
Text Solution
|
- Draw the graph of y = [cos x], x in [0, 2pi], where [*] represents the...
Text Solution
|
- Draw the graph of y = sin pisqrt(x).
Text Solution
|
- The number of roots of the equation xsinx=1,x in [-2pi,0)uu(0,2pi] is ...
Text Solution
|
- Evaluate : [lim(x to 0) (tan x)/(x)], where [*] represents the greates...
Text Solution
|
- For f(x) = sin x - x^(2) + 1, check weather the function is increasing...
Text Solution
|
- Draw the graph of the function f(x)=m a x{sinx ,cos2x},x in [0,2pi]. W...
Text Solution
|
- Draw the graph of [y] = sin x, x in [0,2pi] where [*] denotes the grea...
Text Solution
|
- The total number of solution of sin{x}=cos{x} (where {} denotes the fr...
Text Solution
|
- Draw the graph of f(x) = |sinx| + |cos x|, x in R.
Text Solution
|
- Find the number of solutions to cos x = (x)/(10), x gt 0.
Text Solution
|
- The number of solutions of tanx-m x=0,m >1, in (-pi/2,pi/2) is 1 (b) 2...
Text Solution
|
- Find the number of solutions to log(e) |sin x| = -x^(2) + 2x in [-(pi)...
Text Solution
|
- Solve : Cos x le - (1)/(2).
Text Solution
|
- Prove that the least positive value of x , satisfying tanx=x+1,lies i...
Text Solution
|
- Draw the graph of y = (x^(2))/(10) sin x.
Text Solution
|
- Draw the graph of y = (sin x)/(x).
Text Solution
|