A
B

C

D

Text Solution
AI Generated Solution
The correct Answer is:


Similar Questions
Explore conceptually related problems
Recommended Questions
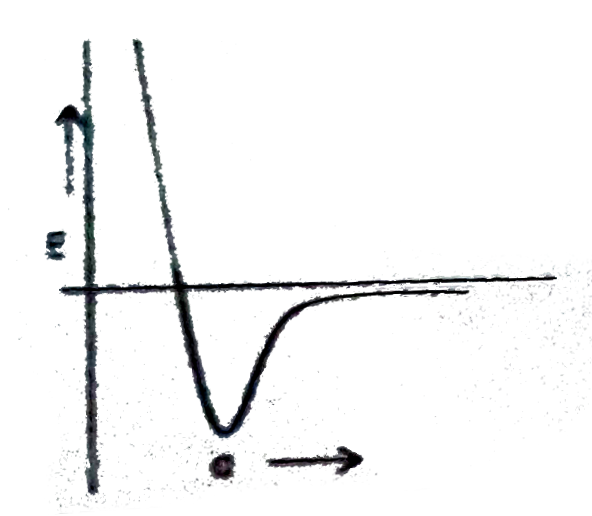
- Which plot best repersent the potential energy (E ) of two hydrogen at...
Text Solution
|
- If the potential energy of the electron in the first allowed orbit in ...
Text Solution
|
- Assertion : Hydrogen peroxide forms only one series of salts called pe...
Text Solution
|
- Teo atoms of hydrogen combine to form a molecule of hydrogen gas, the ...
Text Solution
|
- When two hydrogen atoms approach each other to form H(2) molecule, the...
Text Solution
|
- हाइड्रोजन परमाणु की आयनन ऊर्जा 13.6" eV" है। हाइड्रोजन परमाणु की n = 2...
Text Solution
|
- There are two atoms of hydrogen and one atom of oxygen in one molecule...
Text Solution
|
- If the energy in the first excited state in hydrogen atom is 23.8 eV t...
Text Solution
|
- When two atoms of hydrogen combine to form a molecule of hydrogen gas,...
Text Solution
|