Home
Class 8
MATHS
The given graph describes the distances ...

The given graph describes the distances of a car from a city X at different times when it is travelling from City X to City Y, which are 300 km apart. Study the graph and answer the following:
(i) What information is given on the two axes?
(ii) From where and at what time did the car begin its journey?
(iii) How far did the car go in the first hours?
(iv) Did the car stop for some duration at any place? Justify your answer
(v) Was the speed same during the first three hours? How do you know it?
(vi) When did the car reach City Y?

Promotional Banner

Topper's Solved these Questions

  • INTRODUCTION TO GRAPHS

    MTG IIT JEE FOUNDATION|Exercise NCERT SECTIONS (15.1) |7 Videos
  • INTRODUCTION TO GRAPHS

    MTG IIT JEE FOUNDATION|Exercise NCERT SECTIONS (15.2) |6 Videos
  • INTRODUCTION TO GRAPHS

    MTG IIT JEE FOUNDATION|Exercise OLYMPIAD/HOTS CORNER |5 Videos
  • FOOTSTEPS TOWARDS JEE MAIN

    MTG IIT JEE FOUNDATION|Exercise Section B (Numerical Value Type Questions) |9 Videos
  • LINEAR EQUATIONS IN ONE VARIABLE

    MTG IIT JEE FOUNDATION|Exercise Olympiad/HOTS Corner |15 Videos

Similar Questions

Explore conceptually related problems

The given graph (Fig 15.8) describes the distances of a car from a city P at different times when it is travelling from City P to City Q, which are 350 km apart. Study the graph and answer the following: (i) What information is given on the two axes? (ii) From where and when did the car begin its journey? (iii) How far did the car go in the first hour? (iv) How far did the car go during (i) the 2nd hour? (ii) the 3rd hour? (v) Was the speed same during the first three hours? How do you know it? (vi) Did the car stop for some duration at any place? Justify your answer. (vii) When did the car reach City Q?

The given line graph shows the distance travelled by a motorcyclist from a city A to B at different times. These two cities are 500 km apart. Study the graph and answer the following: (i) What information is given on the two axes? (ii) From where and when did the motorcyclist begin its journey? (iii) How far did the motorcyclist go in the first hour? (iv) How far did the motorcyclist go during 3rd hour? (v) When did the motorcyclist reach city B?

The velocity time graph of the motion of a car is given here.

The distance between city A and city B is 217.352 km. A man travelling from city A to city B covers a distance of 108.178 km. How much more distance he has to cover?

The distance versus time graph of a car is shown in the given figure.

The speed-time graph for a car is shown is Figure (a) Find how far does the car travel in the first 4 seconds. Shade the area on the graph that represents the distance travelled by the car during this period. (b) Which part of the graph represents uniform motion of the car ?

MTG IIT JEE FOUNDATION-INTRODUCTION TO GRAPHS -SOLVED EXAMPLES
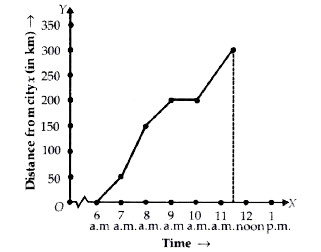
  1. The given graph describes the distances of a car from a city X at diff...

    Text Solution

    |

  2. The sales of a shopkeeper in the first week of january 2012, are given...

    Text Solution

    |

  3. Plet each of the following points on a graph paper : A(5,2)

    Text Solution

    |

  4. Plet each of the following points on a graph paper : B(-2,4)

    Text Solution

    |

  5. Plet each of the following points on a graph paper : C(-4,-6)

    Text Solution

    |

  6. Plet each of the following points on a graph paper : D(4,-3)

    Text Solution

    |

  7. Name the quadrant in which the following points lies: A(2,2)

    Text Solution

    |

  8. Name the quadrant in which the following points lies: B(-2,-6)

    Text Solution

    |

  9. Name the quadrant in which the following points lies: C(4,-2)

    Text Solution

    |

  10. Draw the graph of the function y= 3x and from the graph , find the val...

    Text Solution

    |

  11. Draw the graph of the function y= 3x and from the graph , find the val...

    Text Solution

    |

  12. Write down the co-ordinates of the following points A,B,C and D marked...

    Text Solution

    |

  13. Draw the line graph for the following table:

    Text Solution

    |

  14. Following table gives the temperature at 12 : 00 noon on seven succes...

    Text Solution

    |

  15. In which quadrant do the following points lie ? (6,2)

    Text Solution

    |

  16. In which quadrant do the following points lie ? (-6,8)

    Text Solution

    |

  17. In which quadrant do the following points lie ? (-3,-6)

    Text Solution

    |

  18. In which quadrant do the following points lie ? (2,-3)

    Text Solution

    |

  19. Plot the points A(3,0) , B(5,0) and C(8,0) What do you observe ? Where...

    Text Solution

    |

  20. On which axis do the given points lie? (0,5)

    Text Solution

    |