A
B
C
D
Text Solution
Verified by Experts
The correct Answer is:


Topper's Solved these Questions
Similar Questions
Explore conceptually related problems
SSC SELECTION POST-SSC PREVIOUS YEAR PAPER HSC LEVEL (15 OCT 2019)-Section : Quantitative Aptitude Basic Arithmetic Skill
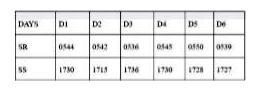
- The Table given below present the sunrise (SR) and sunset (SS) timings...
Text Solution
|
- The selling price of an article is 1(1)/(12) of the cost price. What ...
Text Solution
|
- The Table given below present the sunrise (SR) and sunset (SS) timings...
Text Solution
|
- The average of a series of five numbers, in which each term is greater...
Text Solution
|
- The simple interest on a principal is one-fifth of the given principal...
Text Solution
|
- ABC is a triangle, where angleBAC = 90^(@), If BC = 10 cm. What is the...
Text Solution
|
- The diagonals of a rhombus are respectively 6 cm and 10 cm. What is th...
Text Solution
|
- The total marks for a subject in an examination was 200. It had three ...
Text Solution
|
- 500 showpieces were bought by a person for Rs. 25,000. He spent Rs. 5...
Text Solution
|
- a, b,c d, e are five numbers such that their average is 38. The averag...
Text Solution
|
- What is the value of theta, 0^(@) lt theta lt 90^(@), " if " cos theta...
Text Solution
|
- It is given that the 10-digit number 55y1725x00 is exactly divisible b...
Text Solution
|
- Which among the given numbers are exactly divisible by 7, 11 and 13?
Text Solution
|
- If 15 men can complete a work in 16 days by working 8 hours daily, the...
Text Solution
|
- If (a)/(b) = (c )/(d ) = (e )/(f) = (3)/(4), what is the value of (a+c...
Text Solution
|
- The Table given below present the sunrise (SR) and sunset (SS) timings...
Text Solution
|
- It is given that DeltaABC ~ DeltaEDF and Area DeltaABC : Area DeltaDEF...
Text Solution
|
- If x:y=4:5 , then (2x+3y): (8x-5y) is equal to :
Text Solution
|
- What is the value of (1)/(30.31) +(1)/(31.32)+(1)/(32.33) + …+ (1)/(89...
Text Solution
|
- A train goes from P to Q with an average speed of u km/h and returns f...
Text Solution
|